A data-driven look at who bears the burden, how long outages last, and whether the fire prevention strategy is working
I. Introduction: The Stakes
Public Safety Power Shutoffs—intentional blackouts during high fire-risk weather—have become a defining feature of life in California's fire-prone regions. Utilities de-energize power lines to prevent equipment from sparking wildfires. The logic is straightforward: no electricity, no ignition. The trade-off is also straightforward: millions of Californians lose power, sometimes for days at a time.
Why do utilities shut off power at all? Because when utility equipment does cause fires, those fires tend to be catastrophic.
The Disproportionate Destruction Problem
Utility-caused fires represent a small fraction of California's total wildfire ignitions—roughly 5% in most years. But they account for a vastly disproportionate share of the most destructive fires. Of the 20 most destructive wildfires in California history (measured by structures destroyed), six were confirmed caused by utility equipment, with a seventh (the Eaton Fire) under investigation. The single most destructive fire in California history, the 2018 Camp Fire, was caused by a utility.
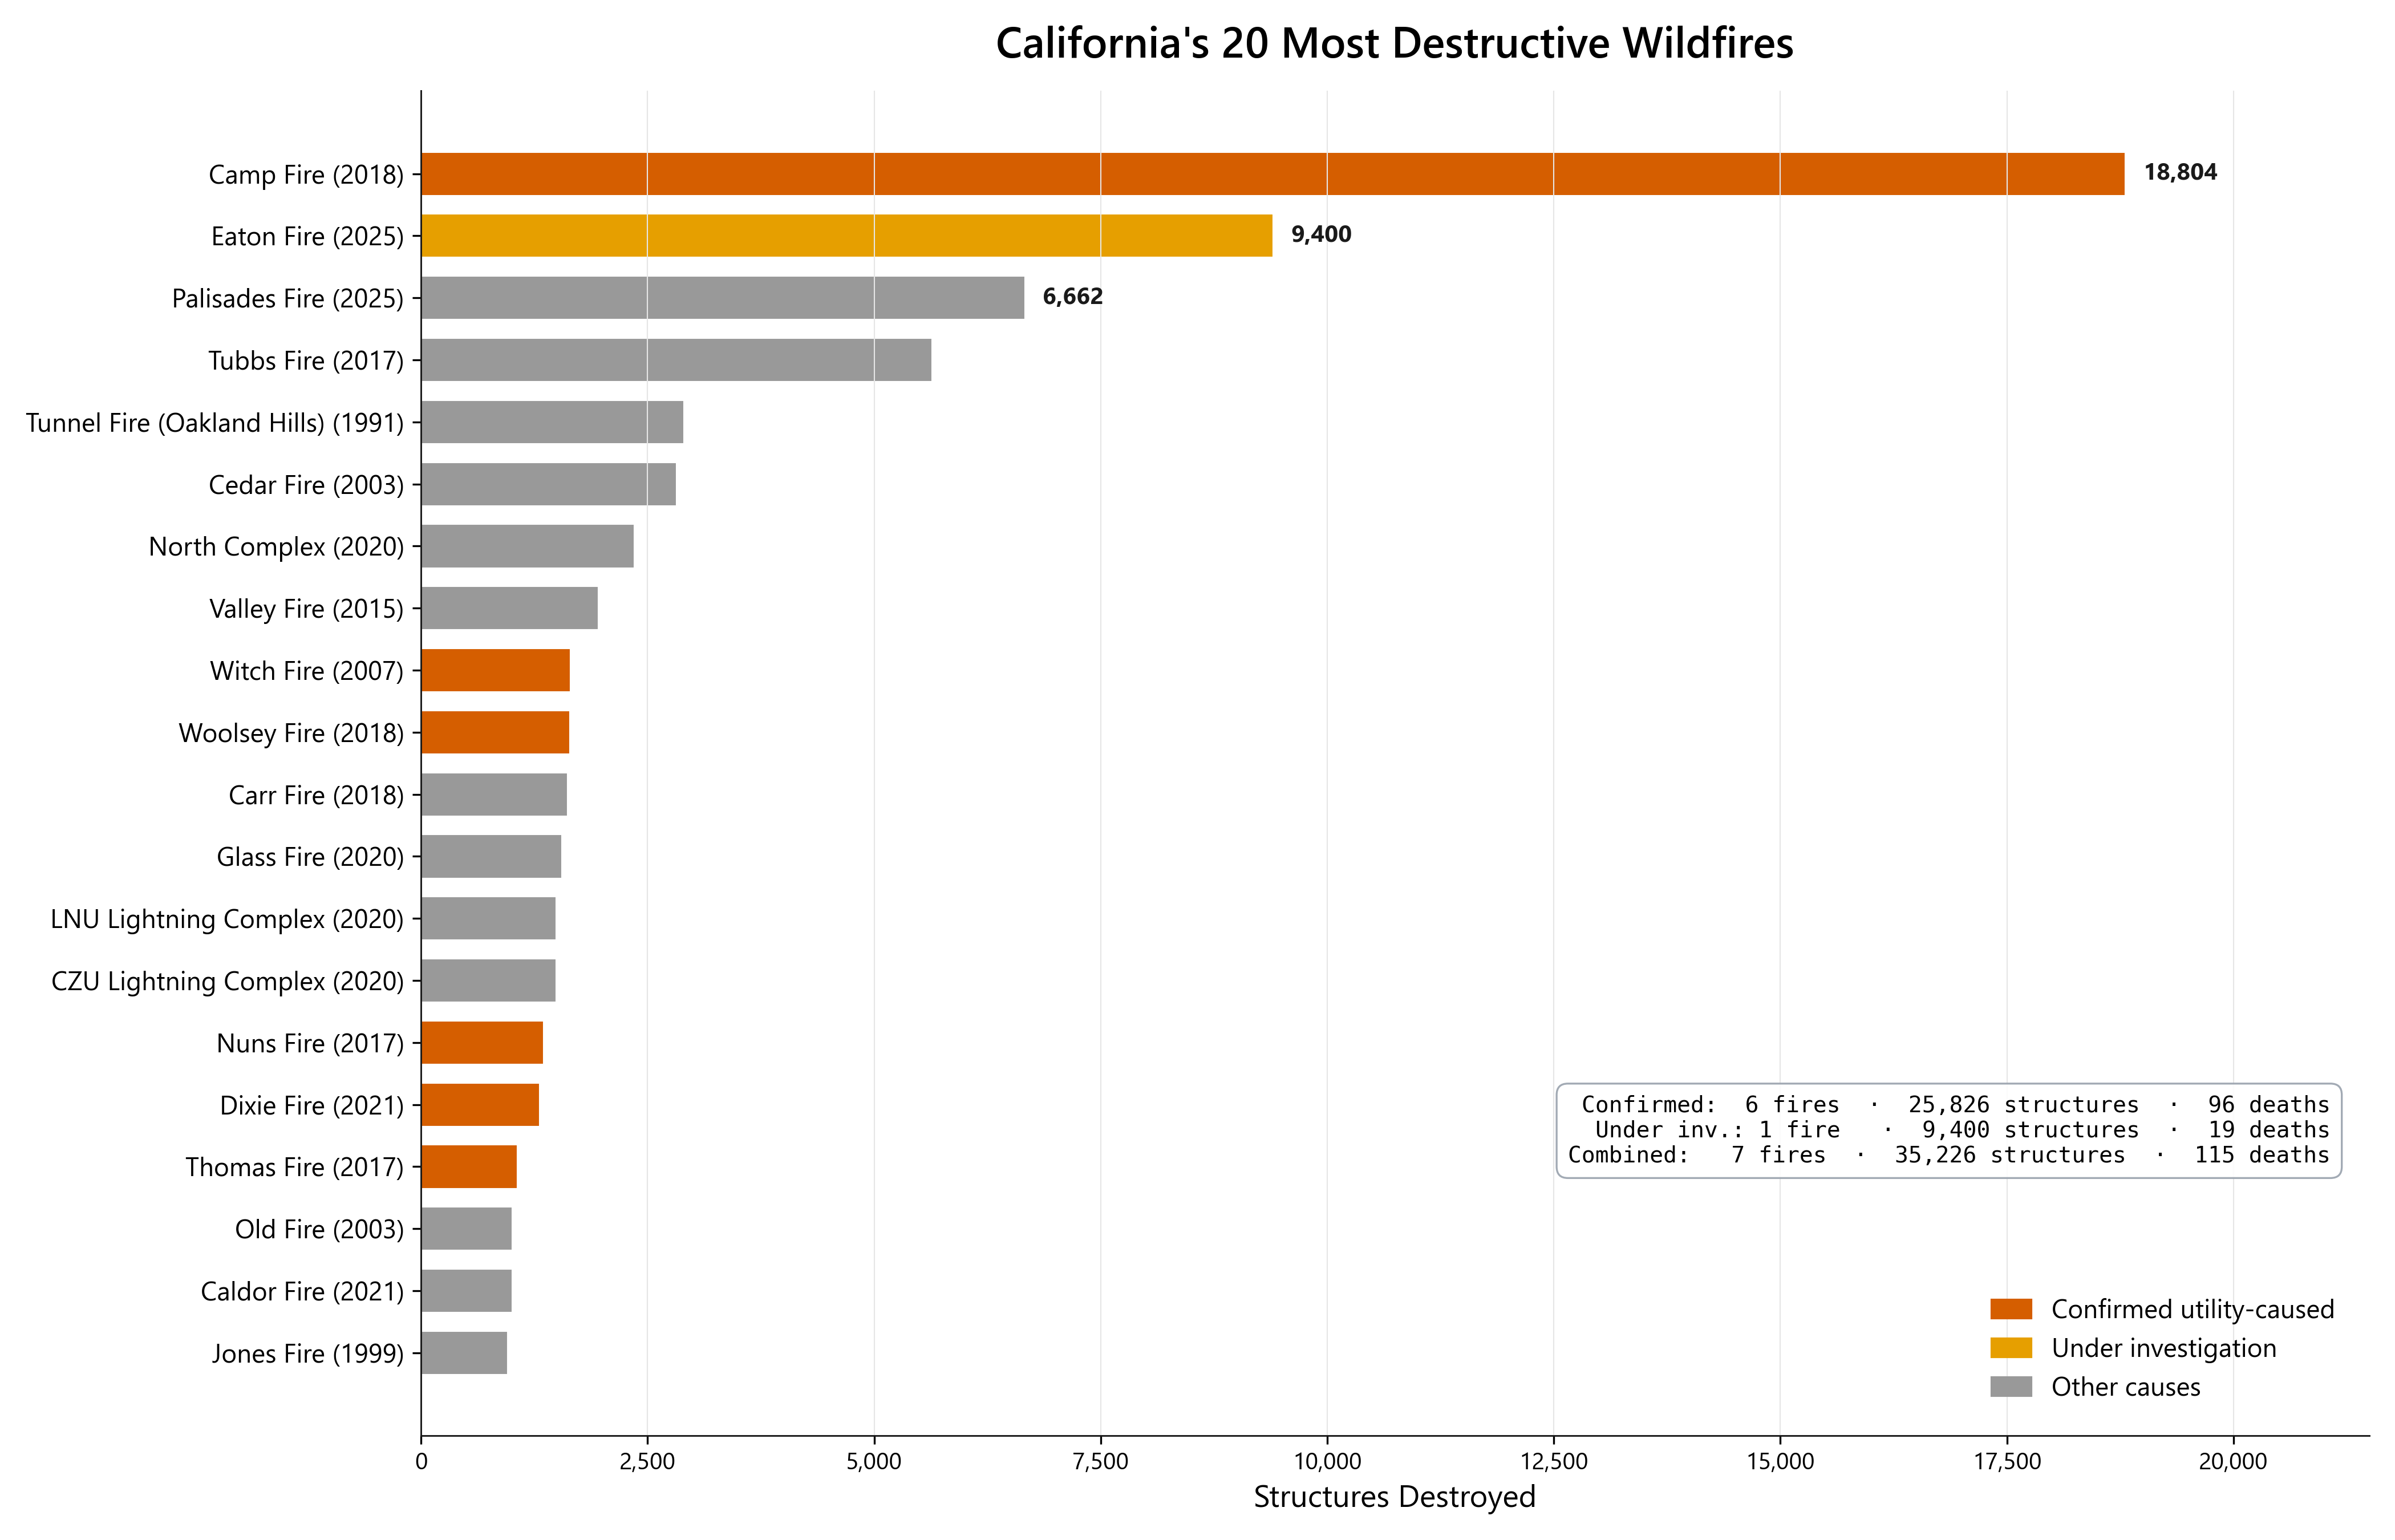 Figure 1: California's 20 most destructive wildfires. Confirmed utility-caused fires (red), under-investigation fires (amber), and other causes (gray). This classification includes only fires where CAL FIRE or CPUC investigations attributed ignition to utility-owned transmission or distribution equipment—not fires classified generally as "electrical" (which can include customer-owned equipment) or fires still under investigation.
Including the Eaton Fire (still under investigation), these seven fires destroyed more than 35,000 structures and killed 115 people—53% of all structures destroyed and 50% of all fatalities across the Top 20 list. Excluding the Eaton Fire, the six confirmed utility-caused fires account for 25,826 structures (39%) and 96 fatalities (42%). The Camp Fire alone destroyed 18,804 structures and killed 85 people; it remains the deadliest and most destructive wildfire in California history.
| Fire | Year | Service Area | Structures Destroyed | Fatalities |
|---|---|---|---|---|
| Camp Fire | 2018 | PG&E | 18,804 | 85 |
| Eaton Fire* | 2025 | SCE | 9,400 | 19 |
| Witch Fire | 2007 | SDG&E | 1,650 | 2 |
| Woolsey Fire | 2018 | SCE | 1,643 | 3 |
| Nuns Fire | 2017 | PG&E | 1,355 | 3 |
| Dixie Fire | 2021 | PG&E | 1,311 | 1 |
| Thomas Fire | 2017 | SCE | 1,063 | 2 |
| Confirmed subtotal | 25,826 | 96 | ||
| Combined total | 35,226 | 115 |
Table 1: Utility-caused and under-investigation fires in California's Top 20 most destructive. Eaton Fire cause under investigation as of the date of this report; SCE equipment involvement alleged in litigation but not officially determined.
Why are utility fires so destructive? The answer lies in timing. Utility ignitions during extreme wind events—Diablo winds in Northern California, Santa Ana winds in the south—produce fast-moving fires that overwhelm evacuation and suppression capacity. A fire that starts at 2 AM during 60 mph winds can consume entire neighborhoods before residents wake up. The conditions that make utility equipment most likely to fail (high winds, dry vegetation) are the same conditions that make fires impossible to contain.
This context explains why PSPS exists—and why understanding its patterns matters.
This Analysis
This report examines 7,150 PSPS circuit-events recorded by California's three largest investor-owned utilities (PG&E, SCE, and SDG&E) between 2013 and early 2025. Some customer-hours analyses use a subset of circuit-events with valid duration and customer counts (n = 6,542).
Terminology note: This report uses circuit-event as the unit of analysis: one distribution circuit de-energized for a contiguous shutoff period. A single PSPS "weather event" typically triggers dozens or hundreds of circuit-events across multiple days as utilities shut off and restore power to different areas.
Key findings from this analysis:
- The median PSPS event lasts 34 hours historically (40 hours in 2024-2025)—68% exceed 24 hours
- The top 20% of circuits account for 73% of all customer-hours lost
- 91% of medical baseline customer exposure occurs during events longer than 24 hours
- About 67% of PSPS customer-hours in the dataset occur in October alone (66.7% with hour-level allocation; n = 6,542)
Taken together, this suggests a relatively concentrated period of exposure for a relatively specific part of the state (i.e. Sierra Nevada foothills, Nevada/Yuba/Lake counties, and Sonoma/Napa wine country in the north; San Gabriel/San Bernardino mountain and Malibu coast areas in the south).
| Month | % of Customer-Hours |
|---|---|
| January | 19.3% |
| February | <0.1% |
| March | <0.1% |
| April | <0.1% |
| May | <0.1% |
| June | 0.7% |
| July | <0.1% |
| August | 1.4% |
| September | 5.0% |
| October | 66.7% |
| November | 3.4% |
| December | 3.5% |
Table: Monthly distribution of PSPS customer-hours (n = 6,542 circuit-events with valid duration and customer data; 608 records excluded for missing customer counts or invalid durations). Customer-hours are allocated at the hour level across calendar months (events spanning month boundaries are split proportionally by hours in each month). Data from CPUC PSPS event reports, 2013-2025.
The concentration is sharp enough to be operationally useful—October is the month to prepare for—but not so complete that other months can be ignored. September, November, December, and January together account for roughly 31% of customer-hours, and individual years can shift significantly depending on when wind events arrive. Within fire season, utilities have limited ability to predict whether the worst week will fall in late September or late October, which means sustained readiness across a multi-month window rather than a single-month surge.
These patterns have concrete implications:
- Backup power planning should target 48–72 hours, not 24 hours. The median event already exceeds a day; one in five exceeds two days.
- Infrastructure investment should target chronic circuits. The 394 circuits with five or more events account for nearly half of all customer-hours—a tractable number for grid hardening prioritization.
- Program design should weight by risk and burden. Medical baseline customers, renters, and residents in remote areas face compounding disadvantages during multi-day outages. Most utility battery rebate programs offer a fixed dollar amount regardless of the customer's circumstances—same rebate whether you're a homeowner in a suburb or a renter on a chronic circuit. That structure tends to be claimed by people who can already afford installation and navigate the process, while the populations bearing the most PSPS burden (renters who need landlord approval, low-income households who can't cover the remaining cost, medically vulnerable customers who need specifically sized systems) face barriers a flat rebate doesn't address.
- Operational surge capacity should plan for October. Two-thirds of all customer-hours concentrate in a single month, which creates a predictable but intense window for utility crews, emergency services, and community resilience centers.
The data also reveals what PSPS reporting can and cannot tell us about wildfire prevention.
II. The Duration Problem
PSPS events last far longer than most people assume—and far longer than most backup systems can handle.
The median PSPS event in our dataset runs 34 hours. That's not "about a day"—it's a day and a half. One in five events exceeds 48 hours. One in ten exceeds 72 hours. The longest events in the dataset stretch past eight days.
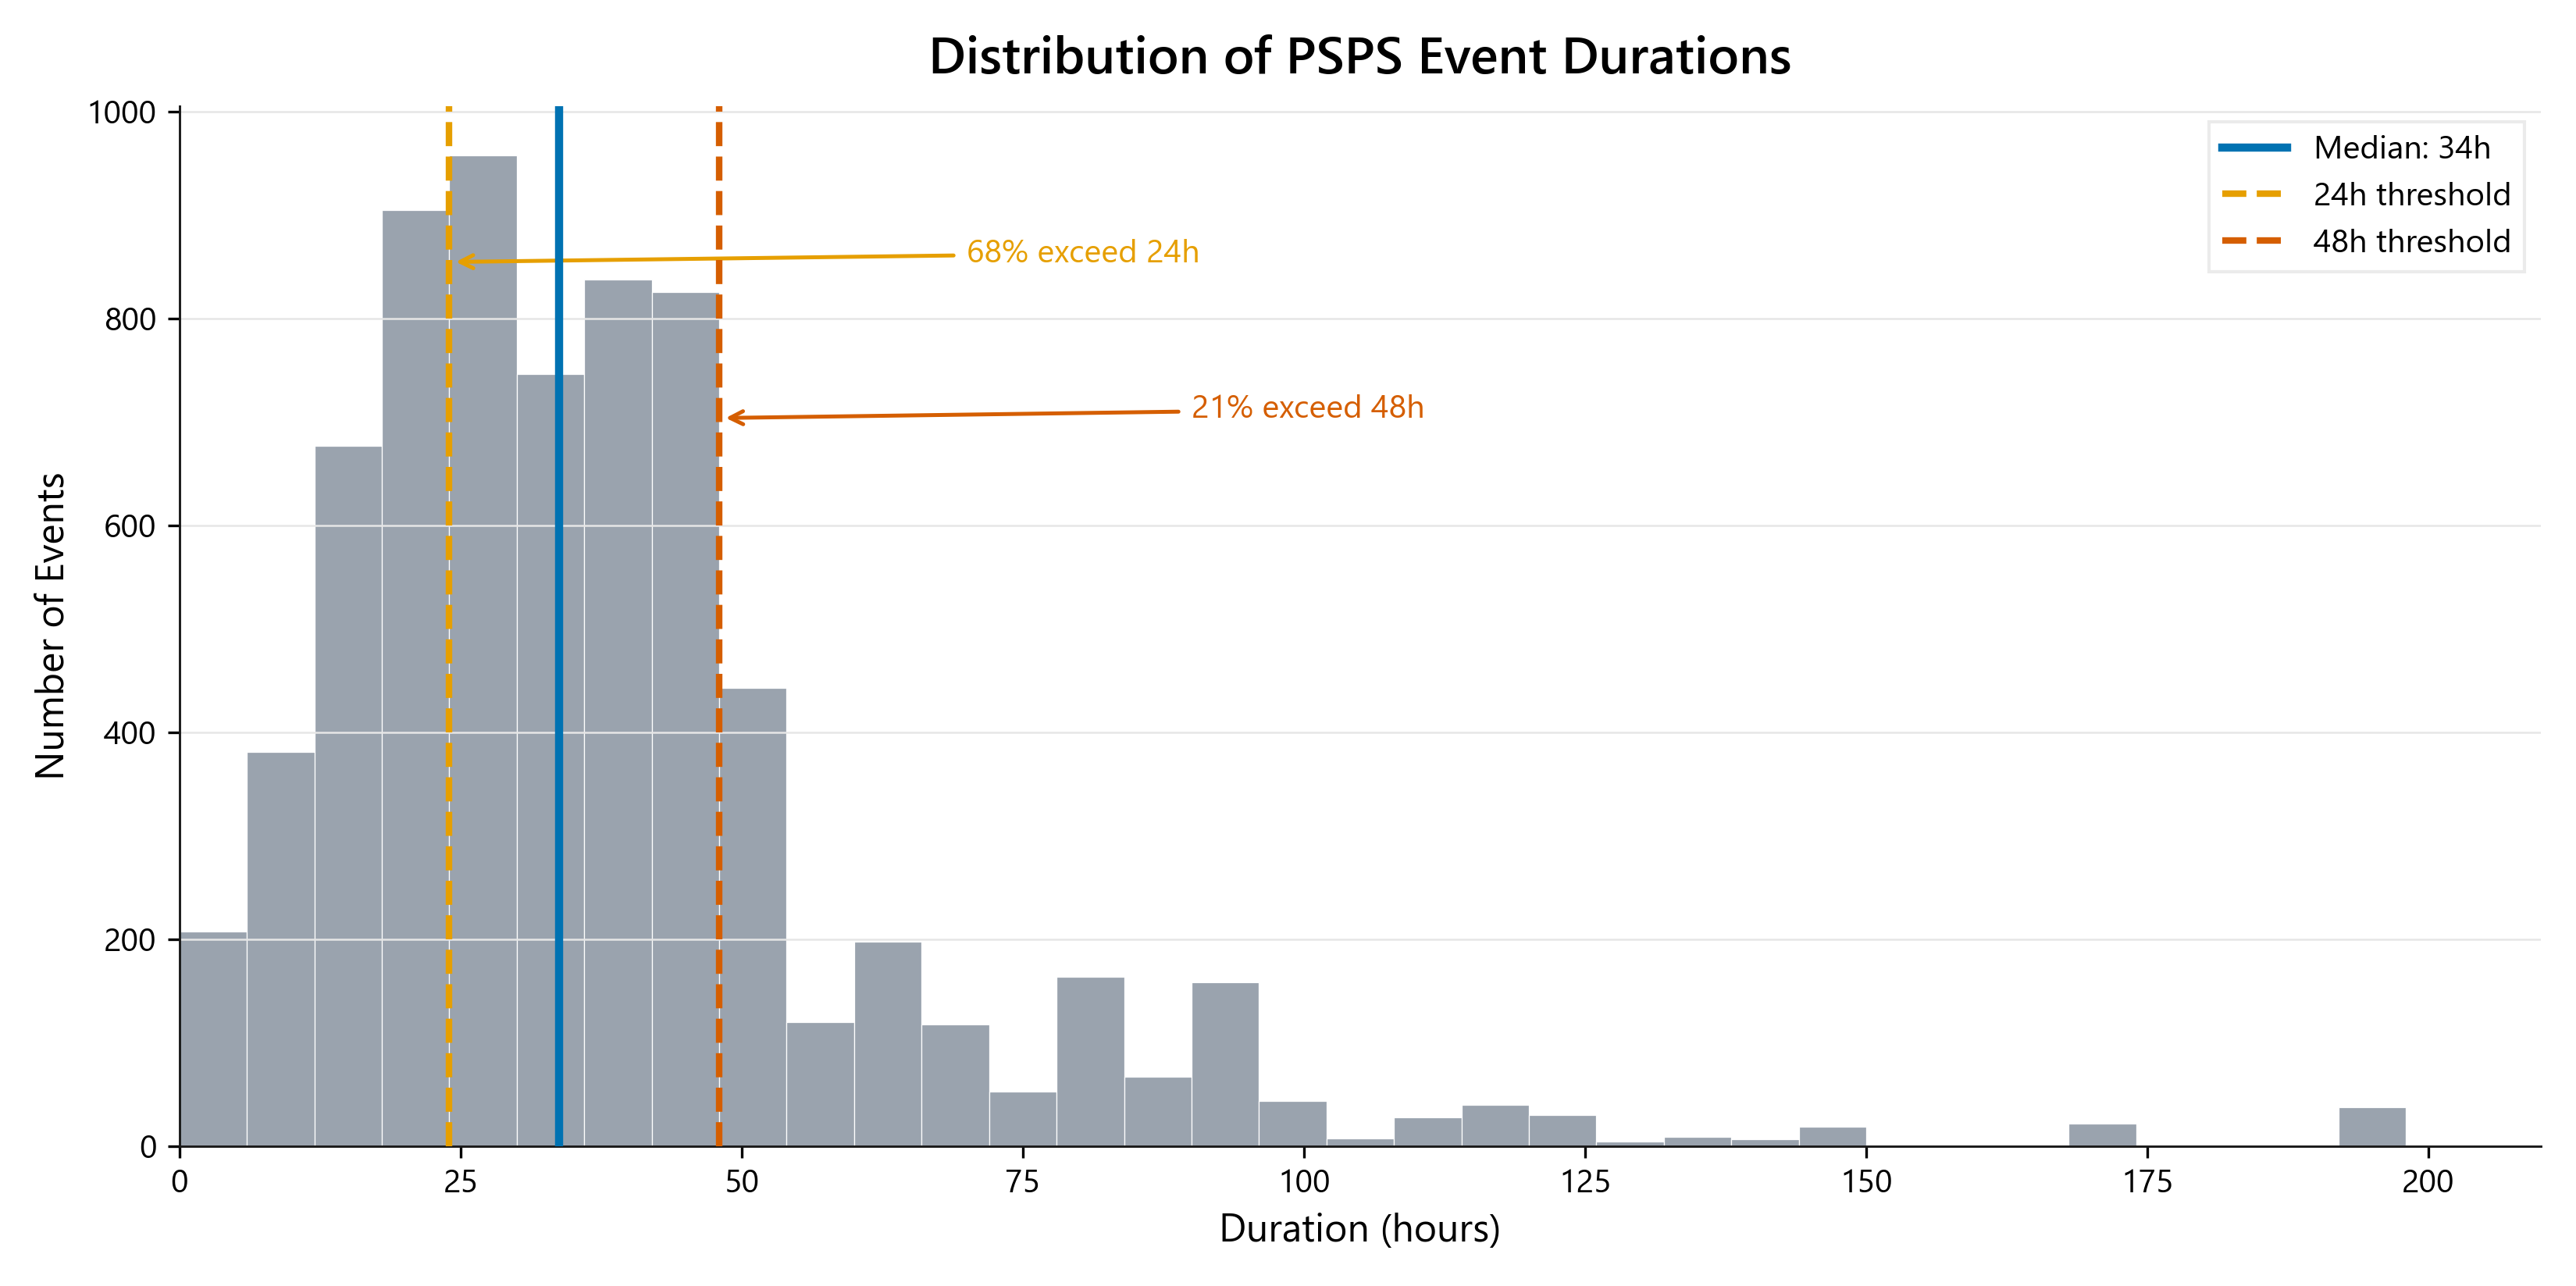 Figure 2: Distribution of PSPS event durations. The median (34 hours) exceeds typical battery capacity. Reference lines show 24-hour and 48-hour thresholds.
Recent Patterns (2024-2025)
The duration patterns documented here reflect data through early 2025. Analysis of the most recent two years (2024-2025, n=1,568 events) shows a median duration of 40 hours, compared to 32 hours in the 2018-2021 period. Seventy percent of recent events exceeded 24 hours, consistent with the historical pattern.
The 2022-2023 period saw anomalously low event counts (110 total) and shorter durations (15-hour median), likely reflecting a combination of mild weather conditions and the initial deployment of Enhanced Powerline Safety Settings (EPSS) on distribution circuits. However, as PSPS has resumed in 2024-2025, duration patterns have returned to levels comparable to or slightly above the pre-EPSS baseline.
While event frequency appears to have declined with EPSS deployment and grid hardening investments, the duration of events that do occur has not meaningfully shortened. This has implications for resilience planning: even if PSPS becomes less frequent, individual events still require multi-day backup capacity.
Planning implication: The 48-72 hour planning target remains appropriate even as the overall PSPS landscape evolves.
Why Duration Matters
A 34-hour outage is qualitatively different from a 6-hour outage. At 6 hours, you eat the food in your refrigerator, light some candles, and wait. At 34 hours, the food in your refrigerator and freezer is spoiling. If you depend on electricity for medical equipment—an oxygen concentrator, a CPAP machine, a powered wheelchair—you've exhausted your battery backup and are now making difficult decisions.
The duration distribution has direct implications for backup power planning:
| Backup Capacity | Share of Events Covered |
|---|---|
| 12 hours (typical home battery) | 8% |
| 24 hours | 32% |
| 48 hours | 79% |
| 72 hours | 90% |
Table 2: Backup power capacity and PSPS coverage. A 24-hour battery covers less than one-third of events.
How does this compare to what Californians are actually installing? SGIP (Self-Generation Incentive Program) data provides an answer. Of the 43,187 active residential battery systems in California's SGIP database, the median capacity is 13.2 kWh—one Tesla Powerwall. At a conservative 1 kW essential load, that's roughly 13 hours of backup. Three-quarters of installed systems are under 24 kWh; 99% are under 48 kWh.
| Capacity Threshold | % of SGIP Residential Systems | PSPS Events Outlasting This Capacity |
|---|---|---|
| < 12 kWh | 35% | 92% |
| < 24 kWh | 74% | 68% |
| < 48 kWh | 99% | 21% |
| ≥ 48 kWh | 1.1% (476 systems) | — |
Table 2b: Installed residential battery capacity (SGIP, as of January 2026, n = 43,187 active systems) vs. PSPS event durations. The vast majority of installed batteries would be exhausted during the majority of PSPS events. Source: SGIP Weekly Statewide Report, selfgenca.com.
The median installed capacity has been essentially unchanged since 2019—13.2 kWh every year. Even in areas that have experienced two or more PSPS events, where residents presumably have the strongest motivation to size for resilience, only 3,400 SGIP battery systems are installed, and their median capacity is the same 13.2 kWh. Just 28 of those systems have enough capacity to last 48 hours.
This confirms that planning targets should be 48-72 hours, not the commonly assumed 24 hours—and that the gap between what people are installing and what PSPS events actually demand is enormous.
Duration by Utility
PSPS durations vary by utility, reflecting differences in territory, wind patterns, and operational practices:
| Utility | Events | Median Duration | Mean Duration | 90th Percentile |
|---|---|---|---|---|
| PG&E | 5,348 | 36 hours | 42 hours | 77 hours |
| SCE | 1,485 | 29 hours | 34 hours | 65 hours |
| SDG&E | 317 | 32 hours | 38 hours | 70 hours |
Table 3: PSPS duration statistics by utility.
PG&E's longer durations likely reflect its vast, mountainous Northern California territory, where circuits often traverse remote terrain that requires extensive patrol before re-energization. SDG&E, which pioneered PSPS in 2013 following devastating 2007 fires, has the smallest footprint but serves terrain with intense Santa Ana wind exposure.
The middle 50% of all events fall between 22 and 47 hours. The mean (40 hours) exceeds the median due to a long tail of multi-day events—those 10% of events exceeding 72 hours pull the average upward.
III. The Concentration Problem
PSPS exposure is not distributed evenly across California's grid. A small fraction of circuits accounts for most of the customer impact—which means targeted investments could yield outsized returns.
When we rank all 2,294 affected circuits by their total customer-hour exposure, the concentration is striking. The top 10% of circuits (229 circuits) account for 47% of all customer-hours lost. The top 20% (459 circuits) account for 73%. The bottom half of circuits—1,147 circuits—account for just 5% of total exposure.
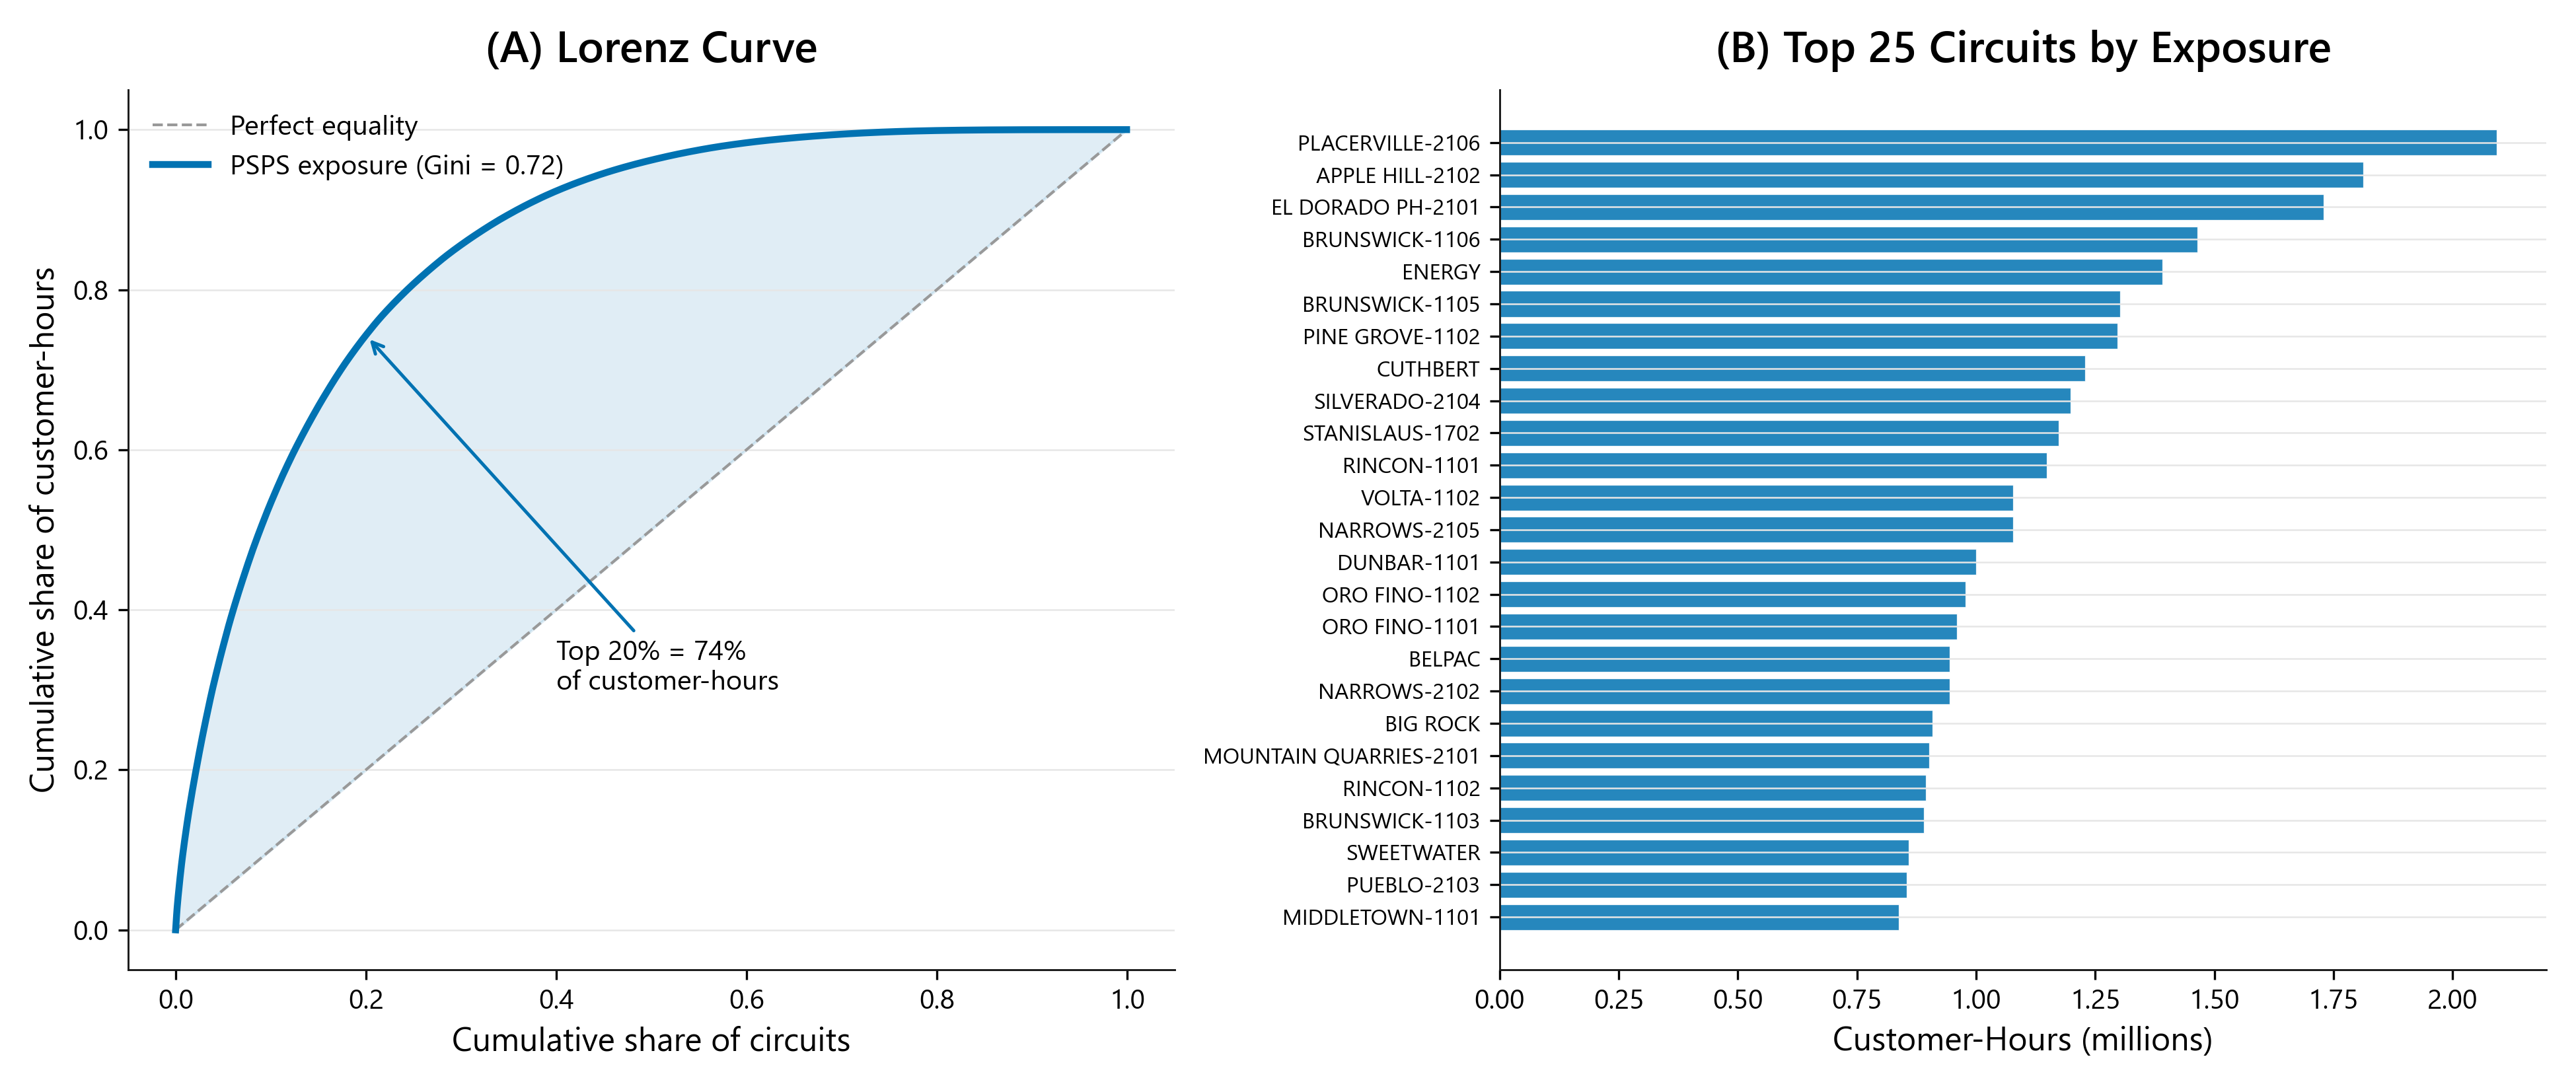 Figure 3: PSPS exposure is highly concentrated. (A) Lorenz curve showing Gini coefficient of 0.70. (B) Top 25 circuits by customer-hours.
The Gini coefficient of 0.70 indicates that PSPS burden is concentrated enough to be targetable. The top 459 circuits account for roughly three-quarters of all customer-hours—a manageable number for prioritized action within existing regulatory processes. California utilities already file Wildfire Mitigation Plans and pre-/post-season PSPS reports with the CPUC; requiring a short "high-burden circuits" annex in those filings—listing the top circuits by customer-hour exposure and the actions planned to reduce that exposure through prevention or faster restoration—would create accountability without adding a new reporting framework. For example, the CPUC could require each utility to identify its top 100 customer-hour circuits in annual WMP updates and report year-over-year changes in exposure for those circuits. That said, which circuits rank highest shifts somewhat year to year depending on weather and fire conditions, so any prioritization list should be updated annually rather than treated as fixed.
Frequency and Severity Are Independent Dimensions
Customer-hours effectively measures aggregate societal impact, capturing which circuits impose the greatest total burden. However, analyzing circuits by frequency and mean duration reveals a surprising pattern: these two dimensions are largely independent, and in some cases, inversely related.
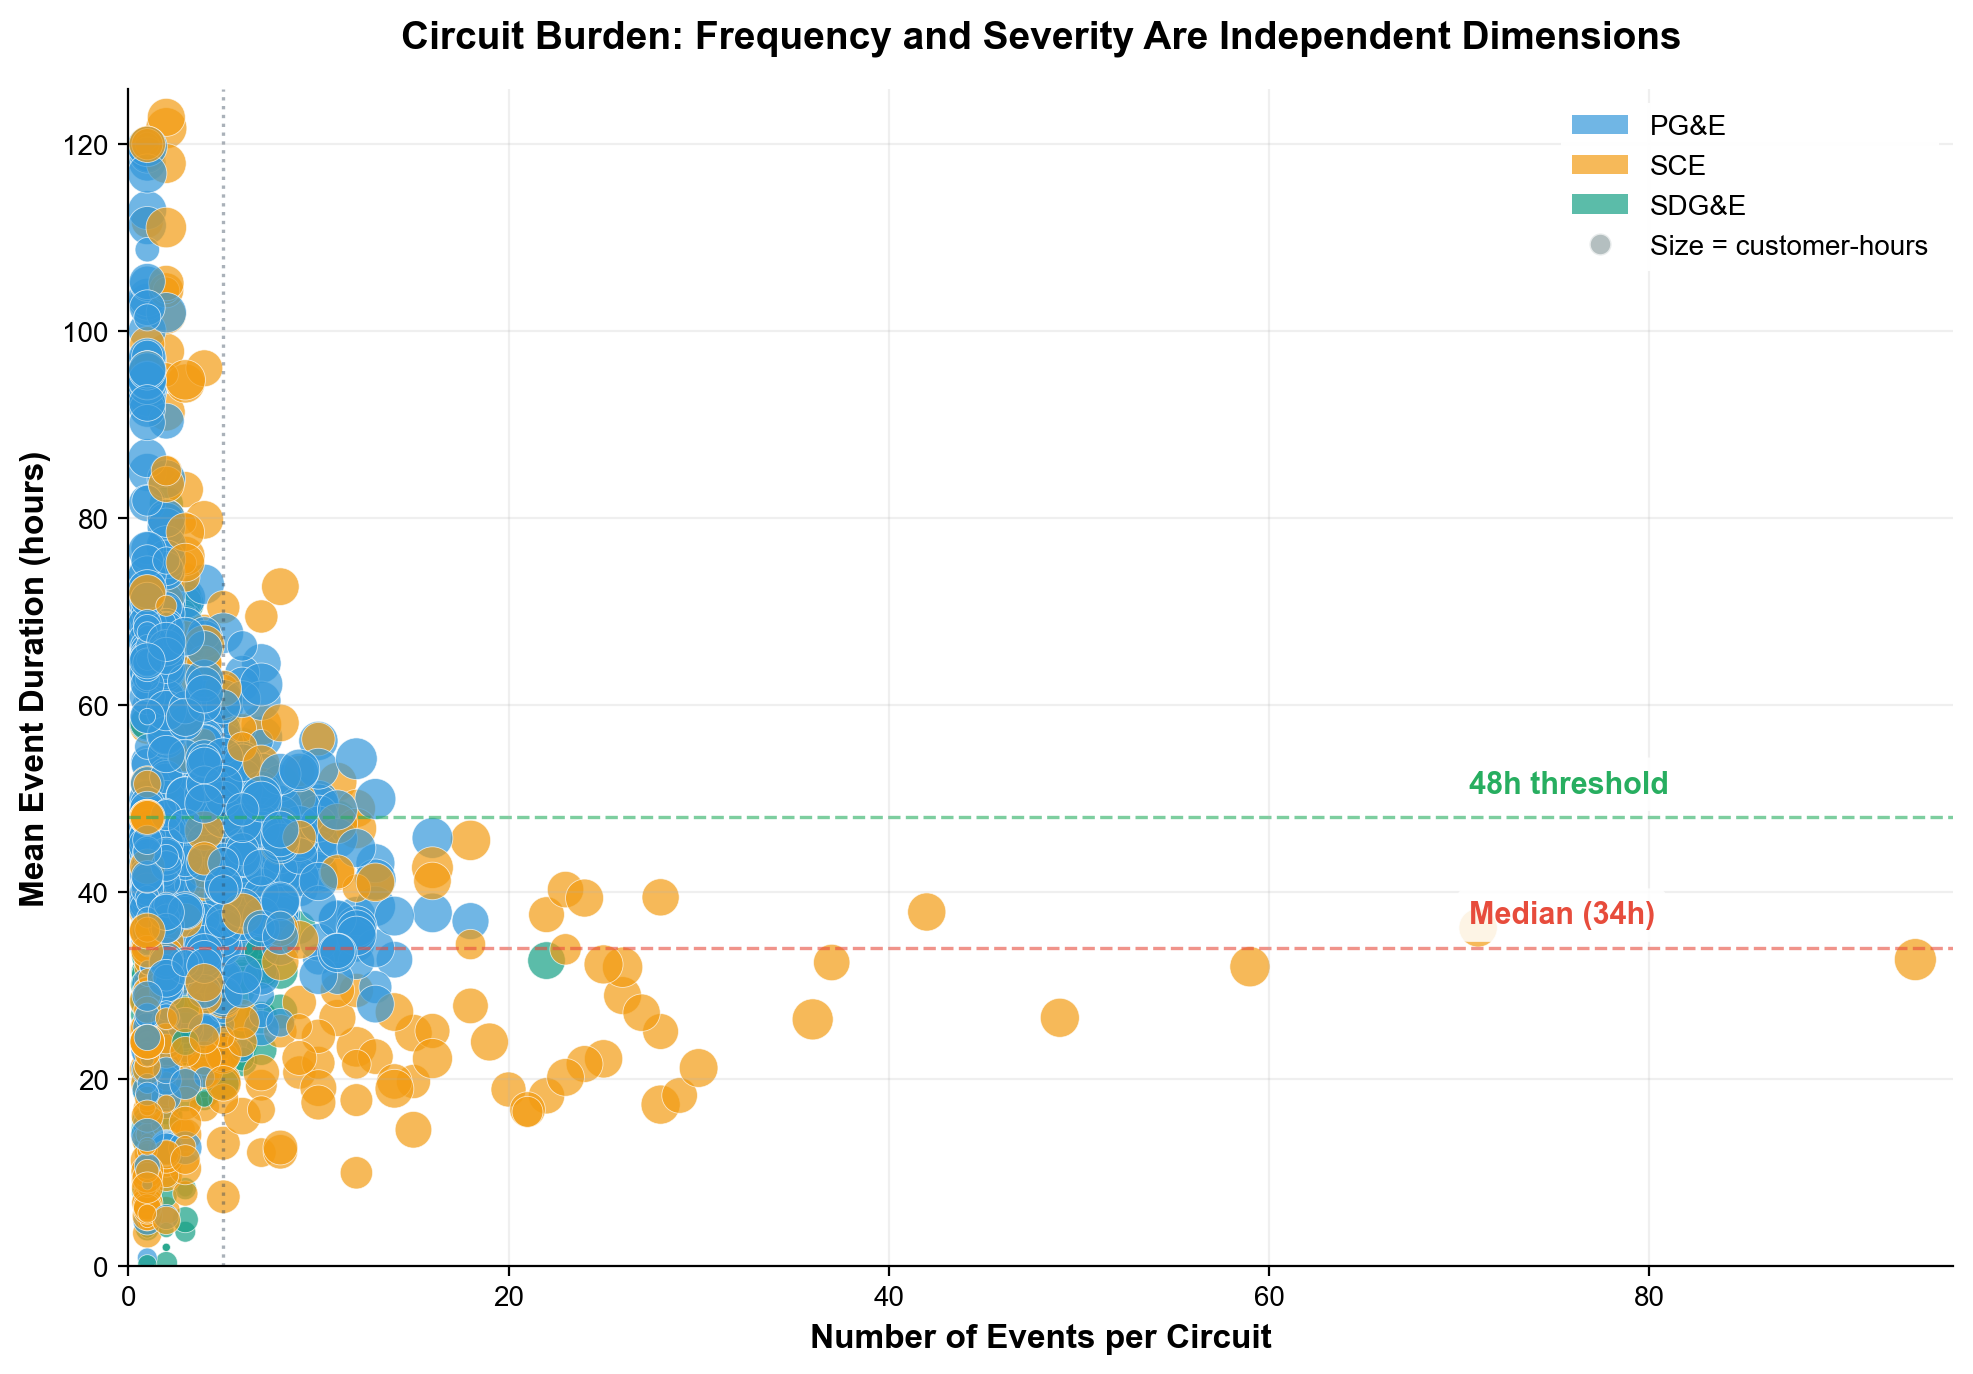 Figure 3b: Circuit burden patterns showing frequency and severity as independent dimensions. Each point represents a circuit, with size indicating total customer-hours. Circuits experiencing more frequent PSPS events tend to have shorter mean durations. This suggests either that utilities become more efficient at restoring repeatedly affected circuits, or that chronic circuits are located in more accessible areas. Point colors indicate utility: PG&E (blue), SCE (orange), SDG&E (teal).
Three distinct burden patterns emerge from this analysis:
-
Chronic but moderate (≥5 events, 20-40 hour means): The majority of "chronic" circuits fall here. These circuits are hit repeatedly but individual events are relatively short. Grid hardening investments can reduce frequency for these circuits.
-
Rare but severe (1-2 events, >100 hour means): Approximately 59 circuits experienced one or two extreme-duration events (100+ hours). These are primarily from 2024-2025 and include the January Los Angeles wind events and August 2025 events affecting SCE territory. While infrequent, these impose catastrophic individual burden.
-
Chronic and severe (≥5 events, >48 hour means): A subset of 97 circuits experience both frequent events and long durations—the worst-case combination. These warrant highest priority for intervention.
Testing whether circuit location (rural vs. urban, measured by customers served) explains duration patterns revealed a nuanced picture: circuits serving more customers have slightly longer average durations, but the most extreme individual events (100+ hours) concentrate in lower-density circuits. This suggests that while urban circuits face restoration complexity from dense infrastructure, rural circuits are more vulnerable to catastrophic outlier events when extreme weather coincides with remote terrain. However, the frequency/severity dimension discussed above provides a clearer operational framework than geographic classification alone.
This finding has a direct planning implication: chronic circuits (those appearing in your "top 394" by frequency) are not necessarily the circuits with longest individual event durations. Rare-but-severe circuits require different interventions—community resilience hubs, microgrids, or targeted long-duration storage—rather than the frequency-reduction strategies (undergrounding, covered conductors) appropriate for chronic circuits.
Chronic Circuits
Some circuits experience PSPS repeatedly; others have been shut off only once. We classified circuits into three categories:
| Category | Definition | % of Circuits | % of Customer-Hours |
|---|---|---|---|
| One-time | 1 event | 46% (1,056) | 13% |
| Occasional | 2-4 events | 37% (844) | 39% |
| Chronic | 5+ events | 17% (394) | 48% |
Table 4: Circuit classification by PSPS frequency.
Chronic circuits represent just 17% of affected circuits but account for 48% of all exposure. The most-affected circuit in the dataset has experienced 94 separate PSPS events over the study period.
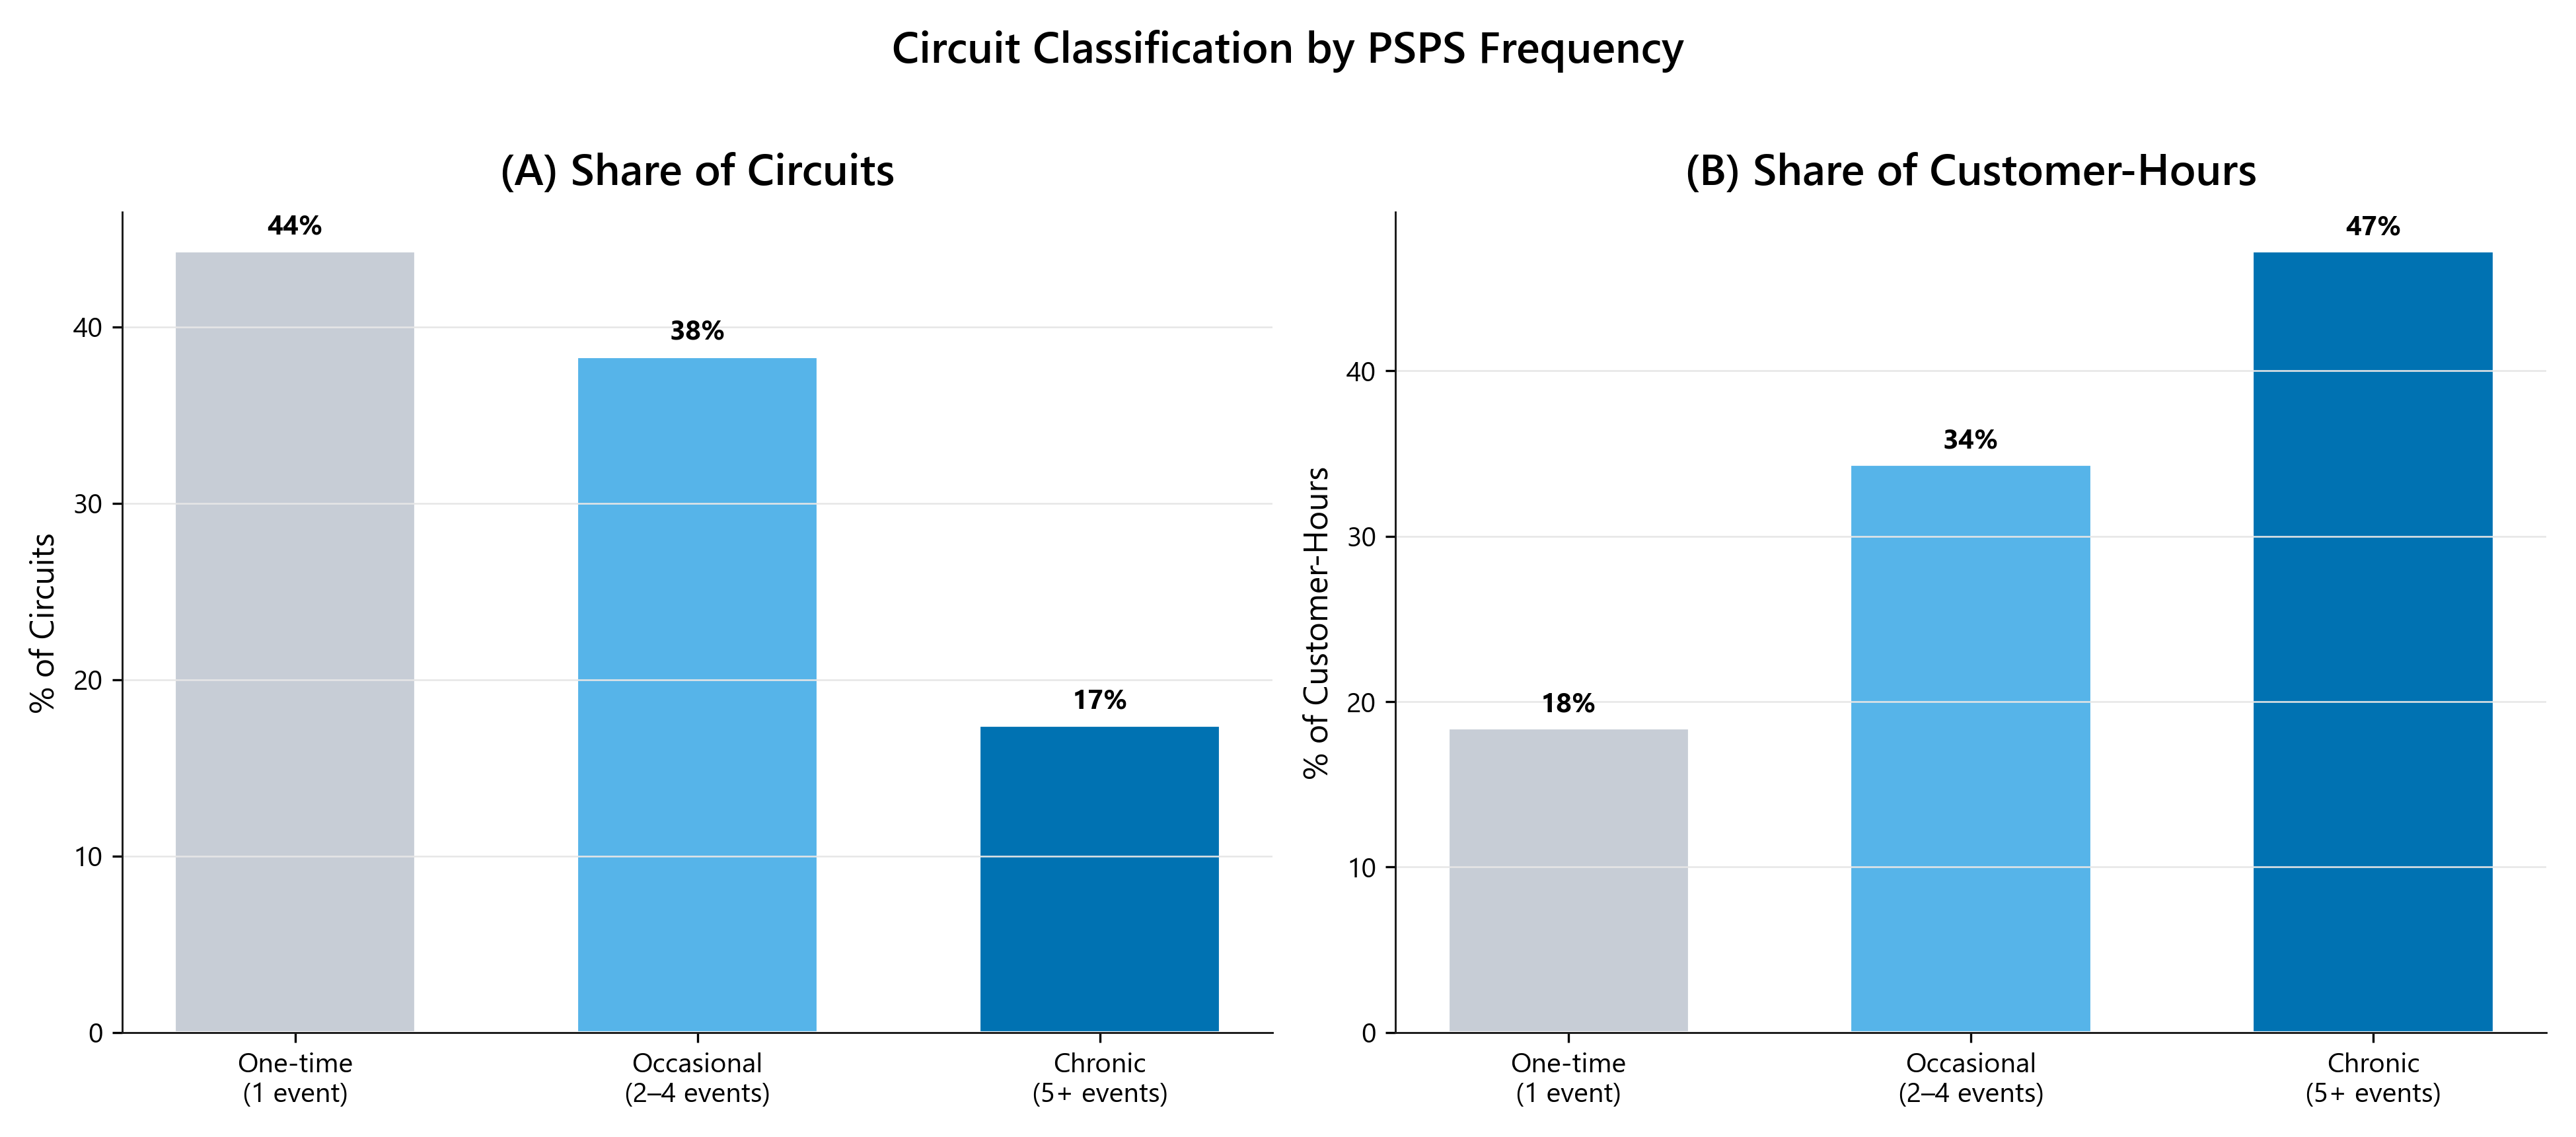 Figure 4: Circuit classification by PSPS frequency. Chronic circuits (5+ events) are 17% of circuits but 48% of customer-hours.
Year-over-year analysis shows substantial consistency in which circuits rank highest. Circuits appearing in the top 50 one year have a 15-20% chance of appearing in the top 50 the following year (calculated by ranking circuits by annual customer-hours within each year, excluding 2022 due to the data gap, and measuring overlap in the top-50 list across adjacent year-pairs). The core set of high-exposure circuits is relatively stable, supporting the case for targeted infrastructure investment.
Duration Patterns Within Circuit Categories
Analysis of individual event durations reveals a counterintuitive pattern: circuits experiencing their first PSPS event tend to have longer durations than circuits with chronic exposure.
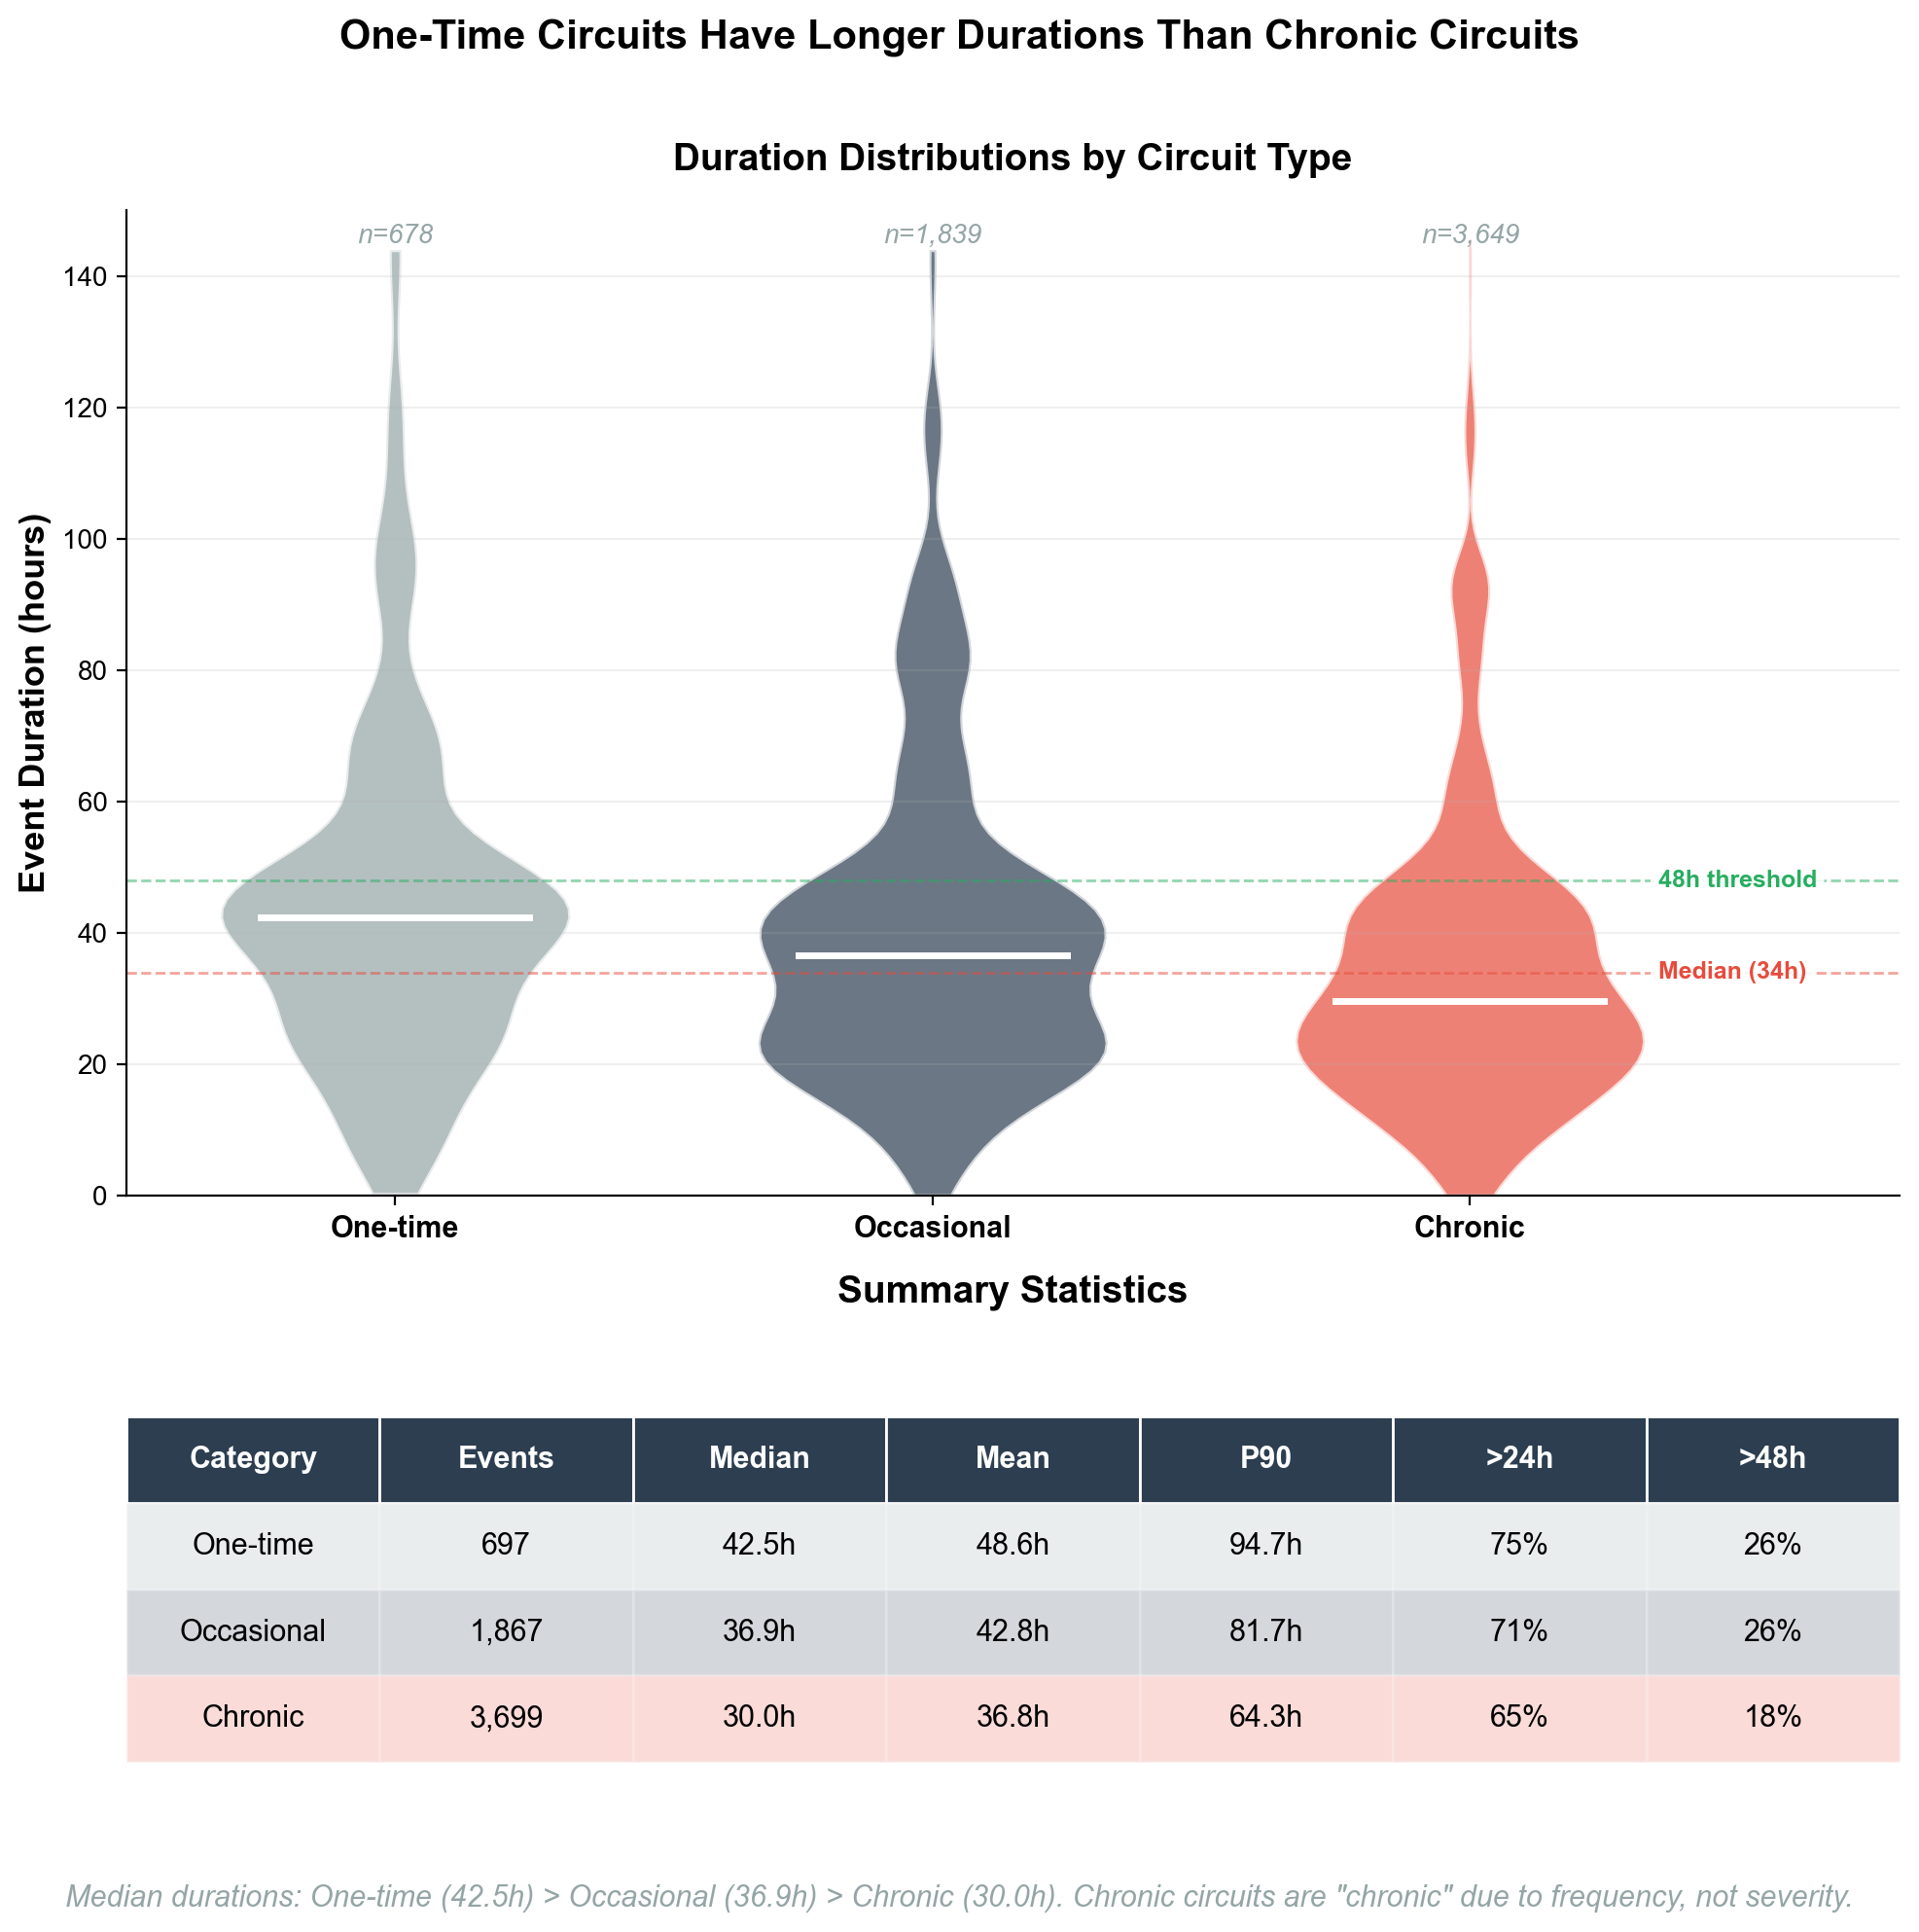 Figure 4b: Duration distributions by circuit type. Violin plots (left) show the full distribution of event durations for one-time, occasional (2-4 events), and chronic (5+ events) circuits. White horizontal lines indicate medians. The summary table (right) quantifies the pattern: one-time circuits have a median duration of 42.5 hours compared to 30.0 hours for chronic circuits—a 12.5 hour difference.
This pattern holds across multiple metrics:
- Median duration: One-time (42.5h) > Occasional (36.9h) > Chronic (30.0h)
- P90 duration: One-time (94.7h) > Occasional (81.7h) > Chronic (64.3h)
- Share exceeding 48h: One-time (26%) > Occasional (26%) > Chronic (18%)
Several explanations are plausible:
-
Operational learning: Utilities may become more efficient at restoring circuits they deal with repeatedly, developing standard procedures and pre-positioning equipment.
-
Geographic accessibility: Circuits hit repeatedly may be in more accessible terrain, while one-time circuits include truly remote or difficult-to-restore locations.
-
Event selection: One-time events disproportionately include extreme weather events (like the January 2025 Los Angeles fires) that cause unusually long outages across all affected circuits.
Regardless of mechanism, the finding clarifies what "chronic" means in this context: high frequency, not high severity per event. The 394 chronic circuits identified earlier face burden primarily through repetition rather than through exceptionally long individual events. Meanwhile, extreme-duration burden (100+ hours) concentrates in circuits experiencing their first or second PSPS event.
Planning implication: Chronic circuit lists should drive grid hardening priorities (reduce frequency), while rare-extreme events require separate resilience planning (prepare for when the rare event happens).
The concentration pattern suggests that grid hardening investments—undergrounding, covered conductor, sectionalizers—should be prioritized by customer-hour exposure, not just cost or geographic coverage. The data to make these prioritization decisions exists; the remaining challenge is translating circuit-level exposure metrics into investment frameworks that utilities and regulators can act on consistently.
IV. The Vulnerable Population Problem
Medical baseline customers—those depending on electricity for life-sustaining equipment like oxygen concentrators, ventilators, and dialysis machines—face disproportionate risk during PSPS events. The duration problem becomes a life-safety problem for this population.
California utilities track medical baseline customers separately in PSPS reporting. When we analyze the distribution of medical baseline customer-hours by event duration, a clear pattern emerges: 91% of medical baseline exposure occurs during events exceeding 24 hours.
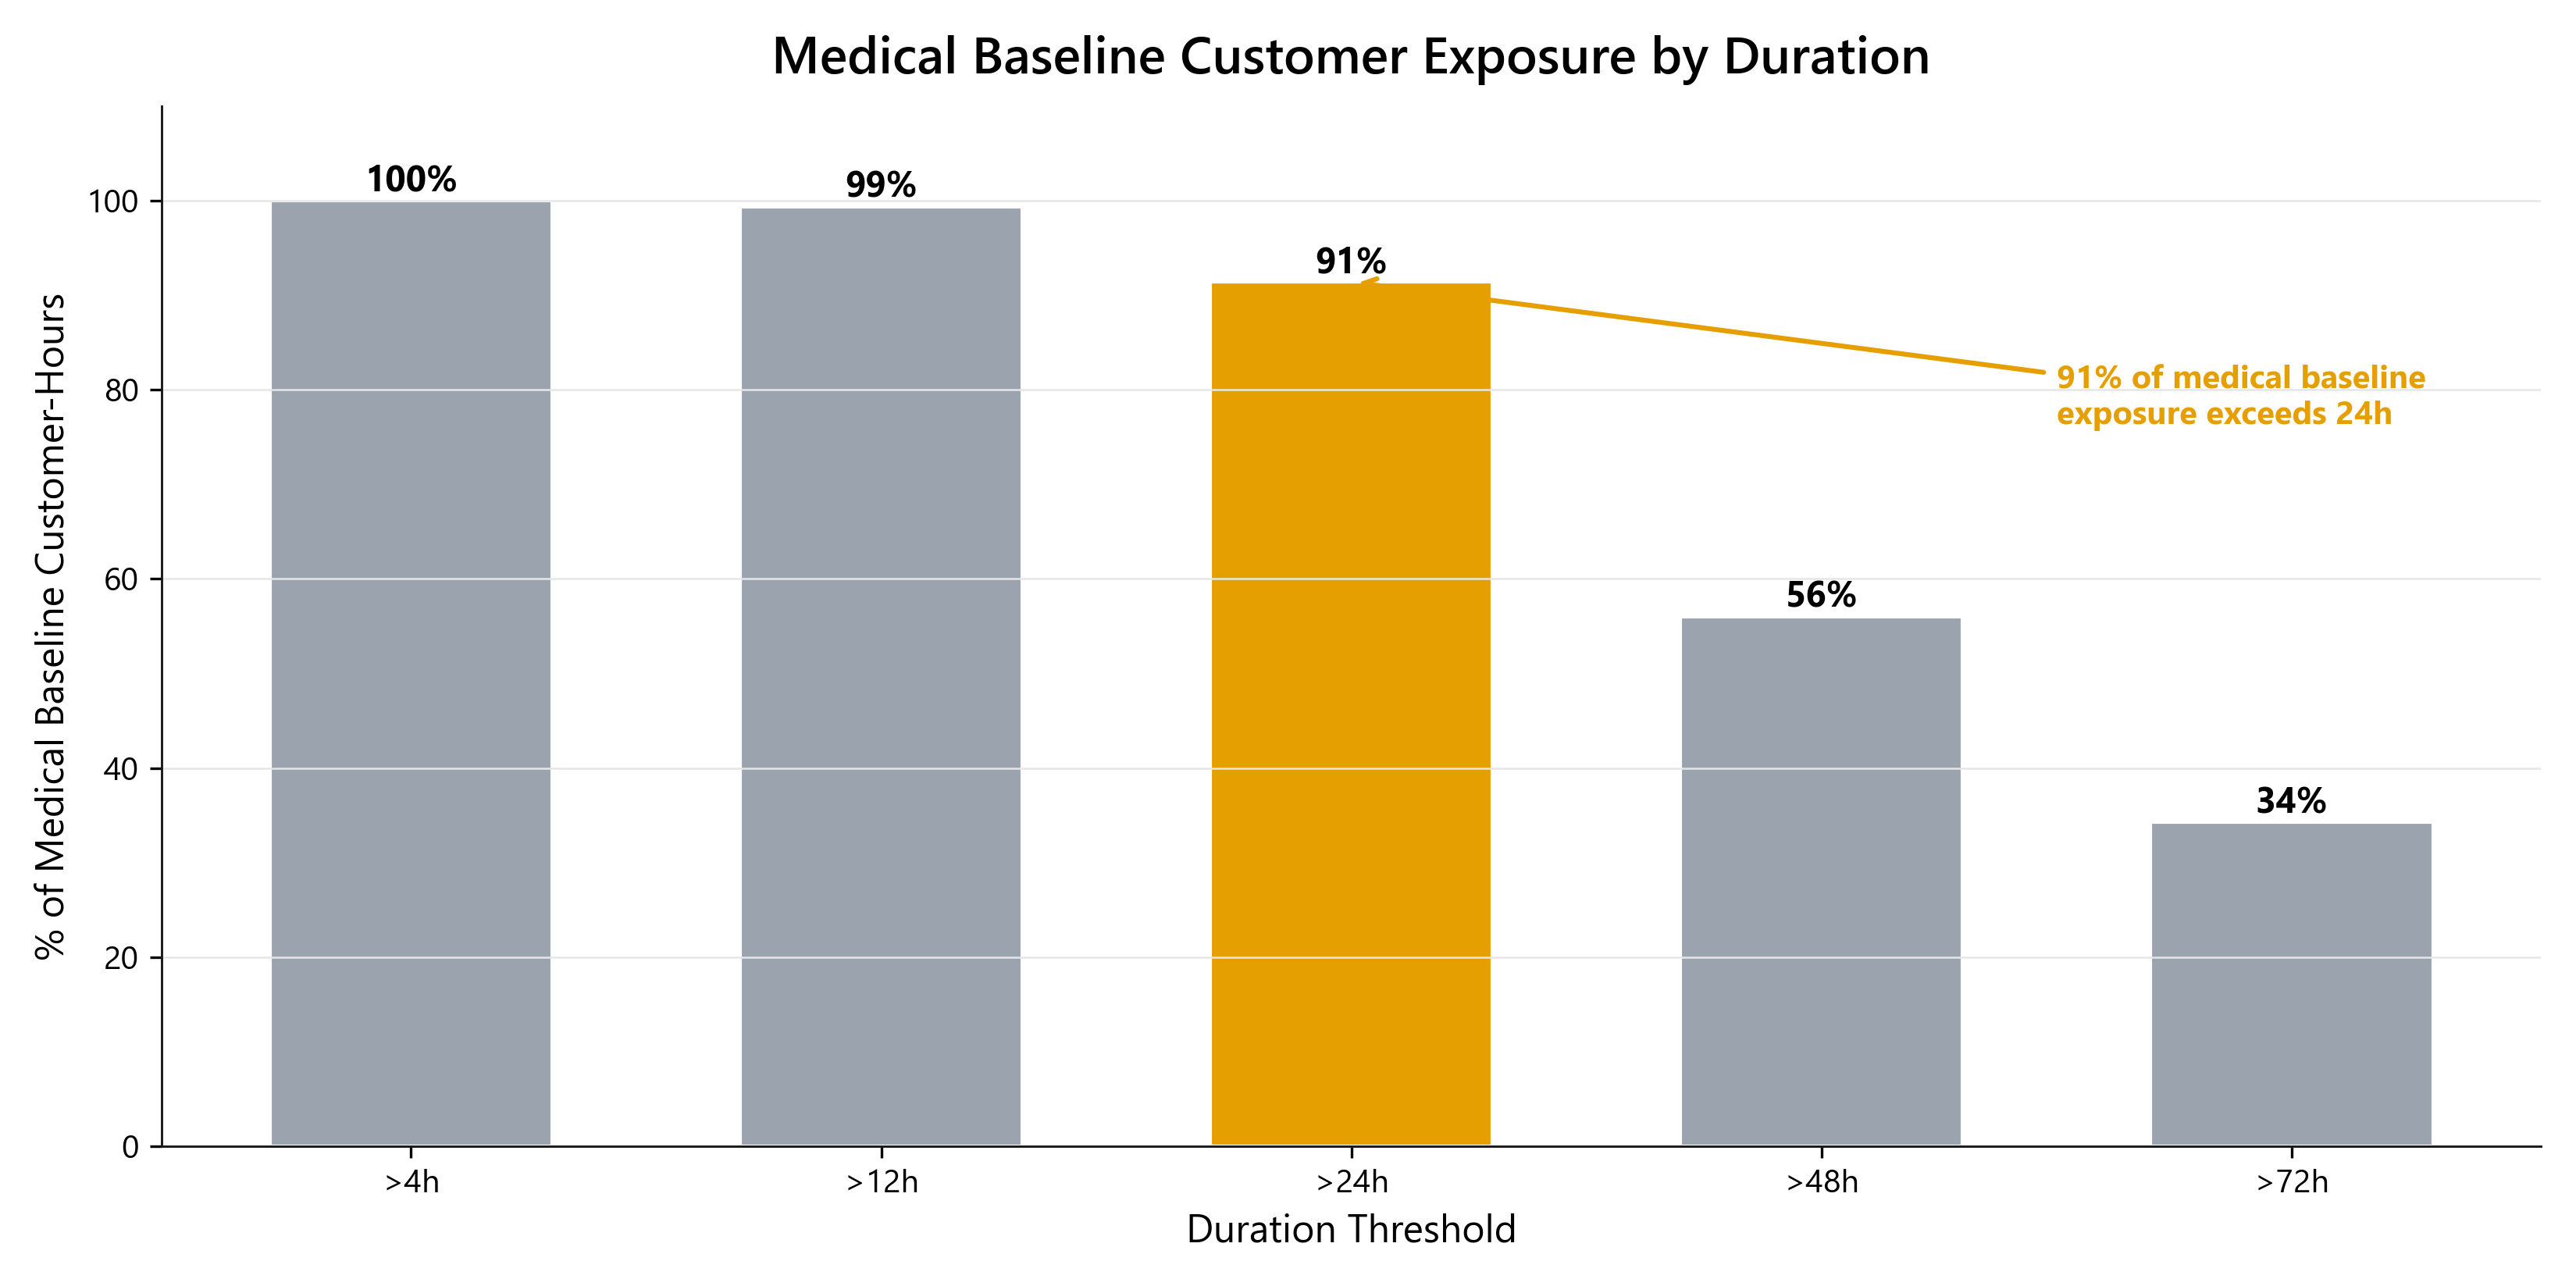 Figure 5: Share of medical baseline customer-hours beyond each duration threshold. 91% of exposure occurs in events exceeding 24 hours.
| Duration Threshold | % of Medical Baseline Customer-Hours |
|---|---|
| > 4 hours | 100% |
| > 12 hours | 99% |
| > 24 hours | 91% |
| > 48 hours | 56% |
Table 5: Medical baseline customer exposure by duration.
The 91% figure has a direct policy implication: battery rebate programs targeting medical baseline customers with 24-hour backup capacity address only about 9% of their actual PSPS exposure. The typical program design—helping customers acquire a battery that lasts a day—leaves them vulnerable during precisely the events most likely to affect them.
What This Means in Practice
A medical baseline customer with a 24-hour battery backup faces a specific scenario during the majority of PSPS events: the battery runs out while the power is still off. At that point, they must either leave their home (often difficult for those with mobility limitations or complex medical equipment), rely on community resilience centers (which may be distant or at capacity), or simply go without life-sustaining equipment.
The program design implication is clear: medical baseline programs should target 48-72 hour capacity, fund community resilience centers as a backup, and provide proactive outreach during extended events—not just pre-event notification.
V. The Question This Analysis Can't Answer
Everything documented above—the duration problem, the concentration of exposure, the battery gap, the burden on medical baseline customers—describes the cost side of PSPS. But there is a harder question that this dataset alone cannot resolve: is it working?
Something appears to be working. PG&E's reportable ignitions in High Fire Threat Districts have declined in recent years. The trend is encouraging. But between 2018 and 2024, utilities deployed PSPS alongside half a dozen other interventions—EPSS automatic shutoffs, accelerated vegetation management, undergrounding, covered conductor, expanded weather monitoring—all on overlapping timelines, against a backdrop of year-to-year weather variation.
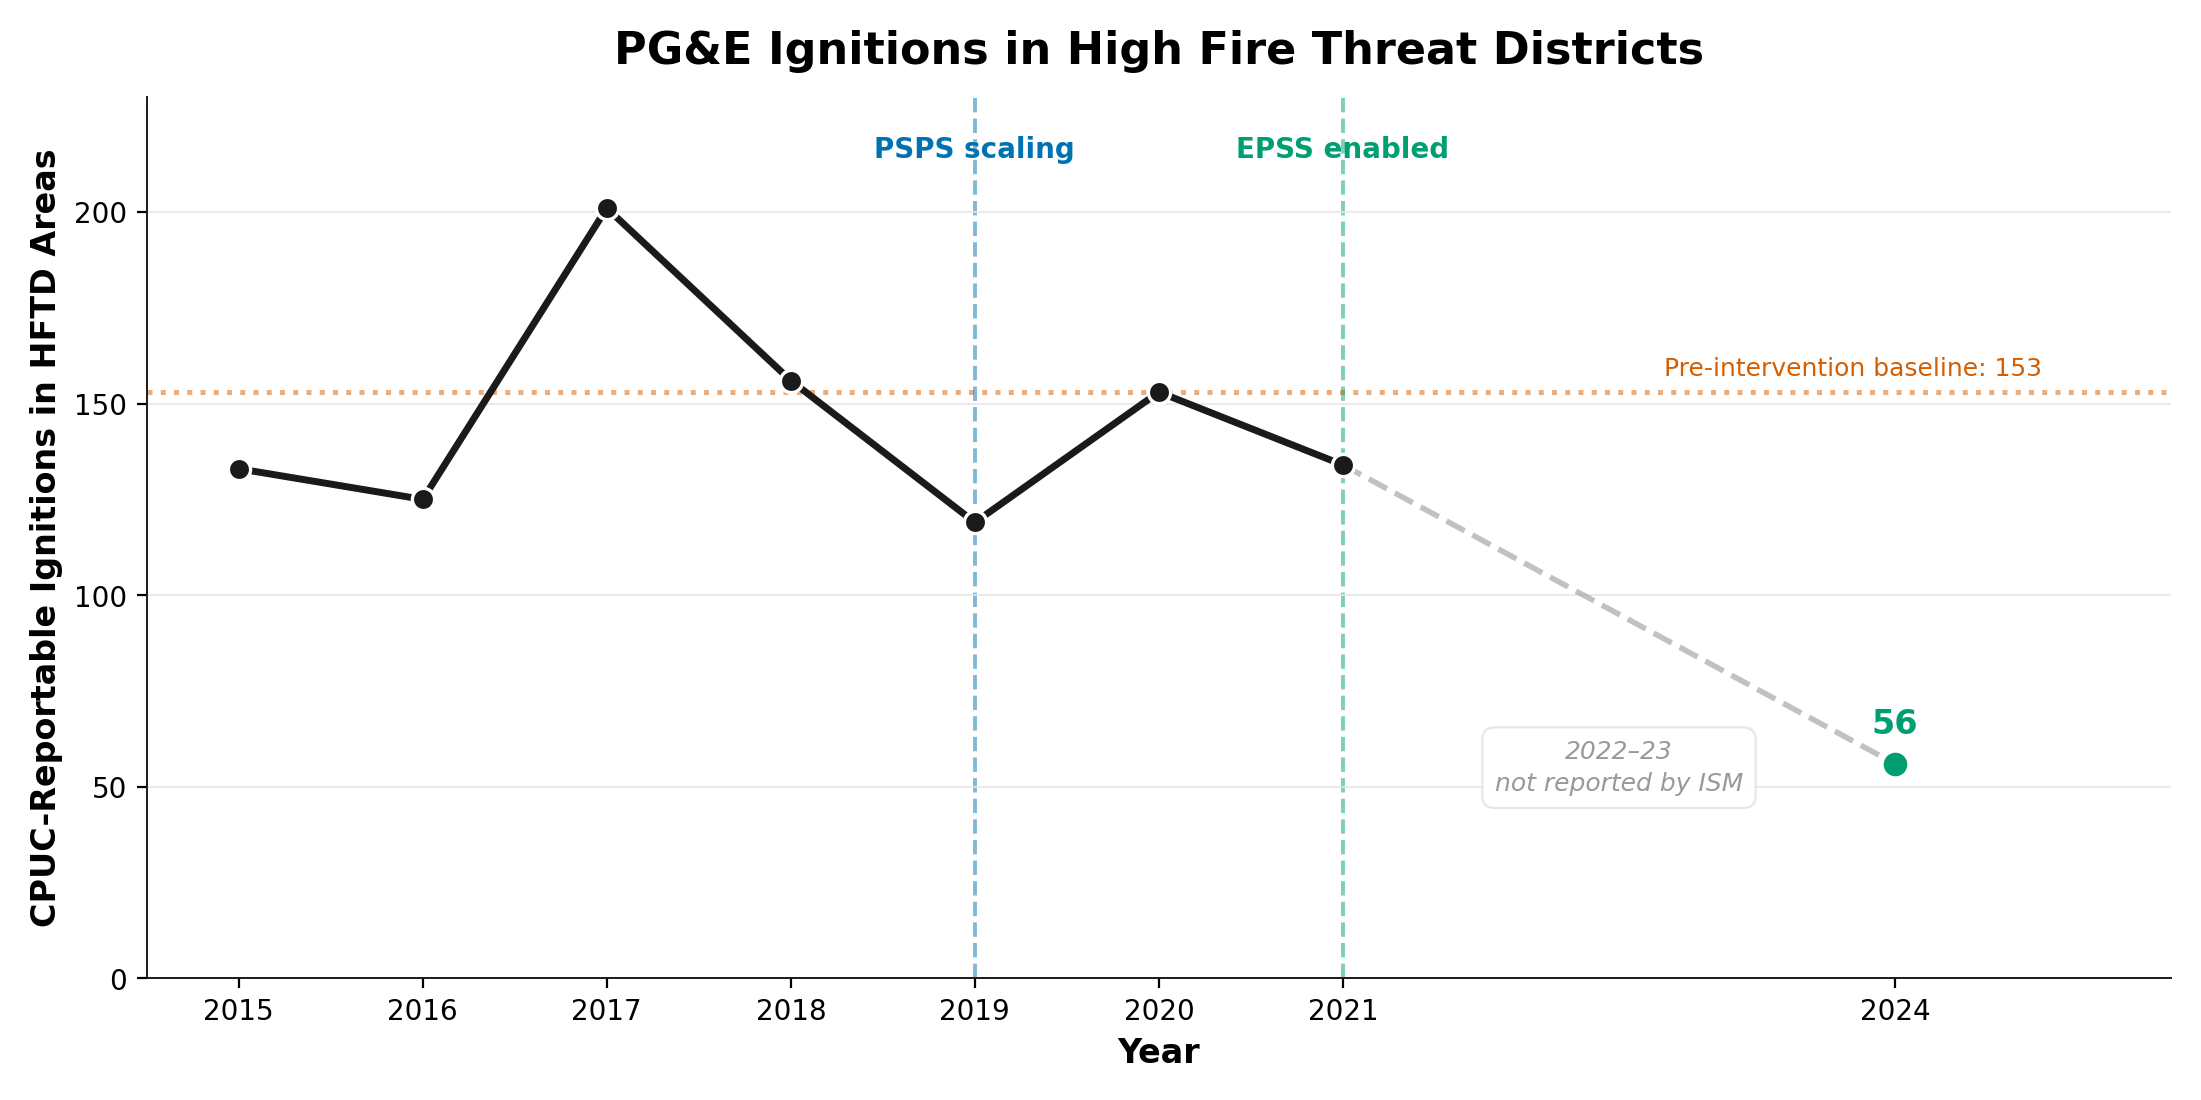 Figure 6: PG&E ignitions in High Fire Threat Districts, 2015-2024. Multiple interventions were deployed during this period; attribution to any single intervention is not possible from this data.
The ignition decline is real. Which interventions deserve credit—and how much—is not something aggregate trend data can answer. That question requires a different kind of analysis, one that can disentangle overlapping interventions and control for weather. It is the subject of a forthcoming companion piece.
EPSS and the Evolving PSPS Landscape
This analysis focuses on Public Safety Power Shutoffs—intentional, long-duration outages during high fire-risk weather. A related but distinct source of fire-related customer impact is Enhanced Powerline Safety Settings (EPSS), which automatically de-energize circuits when fault conditions are detected. EPSS events are typically brief (seconds to minutes) but more frequent than traditional PSPS.
Utility operators report that EPSS impacts may now exceed PSPS impacts in aggregate, though the nature of the burden differs significantly: many brief interruptions versus fewer but multi-day outages. EPSS effectiveness and customer impact patterns warrant dedicated analysis but are beyond the scope of this study.
The rollout of EPSS beginning in 2021-2022, combined with vegetation management and covered conductor deployments, has contributed to reduced PSPS event counts in some years. However, PSPS has not been eliminated, and when events do occur, durations remain substantial. This analysis treats PSPS as a persistent—if evolving—feature of California's wildfire mitigation toolkit.
VI. Data and Methods
Data Sources
PSPS Event Data: Circuit-level PSPS event data reported to the California Public Utilities Commission (CPUC) by investor-owned utilities, 2013-2025. Raw dataset contains 7,243 records; after cleaning, 7,150 circuit-events.
Fire Cause Data: CAL FIRE Top 20 Most Destructive Wildfires list, supplemented with cause determinations from CAL FIRE investigation reports, CPUC proceedings, and news coverage.
Utility Ignition Data: CPUC Fire Incident Reports (2014-2024) and utility Wildfire Mitigation Plan filings. HFTD classification based on CPUC Fire-Threat Map (Tier 2 and Tier 3 areas).
Battery Storage Data: SGIP Weekly Statewide Report (as of January 26, 2026), downloaded from selfgenca.com. Contains 106,217 incentive application records; analysis filtered to 43,187 active (non-cancelled) residential energy storage systems.
Data Processing
- Circuit name standardization: Merged 1,141 duplicate names due to inconsistent formatting (hyphens, spaces, capitalization)
- Utility name normalization: Standardized to PG&E, SCE, SDG&E
- Transmission exclusion: Removed 631 records for transmission infrastructure (identified by "KV" in circuit names). This heuristic may imperfectly distinguish transmission from distribution; results should be interpreted as distribution-focused.
- Duration filtering: Excluded records with invalid durations (—0 or >500 hours)
- Medical baseline cleaning: Imputed missing values using circuit-level averages where available. This imputation may introduce bias if missingness is non-random across utilities or time periods.
Key Metrics
Customer-hours = Customers affected × Duration in hours. This metric captures total disruption magnitude better than customer counts or event counts alone.
Gini coefficient = Standard measure of distribution inequality, calculated from the Lorenz curve. Values range from 0 (perfect equality) to 1 (perfect inequality).
Known Limitations
| Issue | Impact |
|---|---|
| 2022–23 low counts | PG&E had zero PSPS de-energizations in 2022 and only four events in 2023; SCE had 14 and 71 respectively. These are genuine operational lows (milder weather, grid hardening), not reporting gaps. Year-over-year overlap analysis excludes 2022 because too few events exist to measure circuit persistence. |
| Pre-2017 HFTD data | HFTD ignition counts not available before 2015; trend analysis limited |
| January 2025 LA fires | Eaton Fire data preliminary; final attribution pending investigation |
| ENERGY circuit (SCE) | 94 events; may be data entry artifact rather than single physical circuit |
| County assignments | Approximated from circuit name prefixes |
Igor Geyn | CPUC PSPS Event Reports, CAL FIRE, CPUC Fire Incident Data | January 2026