The Benefits of PSPS Are Simulated, Not Measured
76,314
acres "avoided" in 2024 — simulated
100%
effectiveness assumed by the best published EPSS study
0
published checks against observed ignition outcomes
The Trap: Shut-Off Days Show 15× More Ignitions
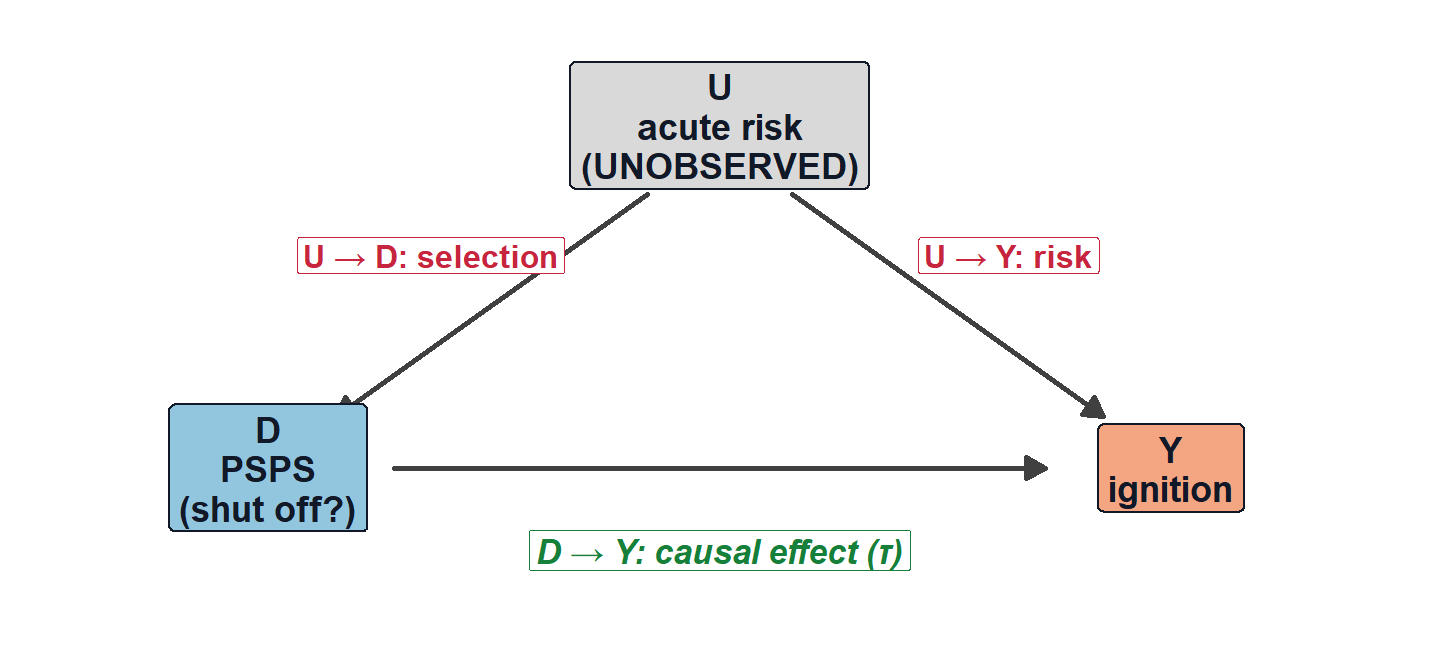
Step 1: Compare Only Where Shutoffs Were on the Table
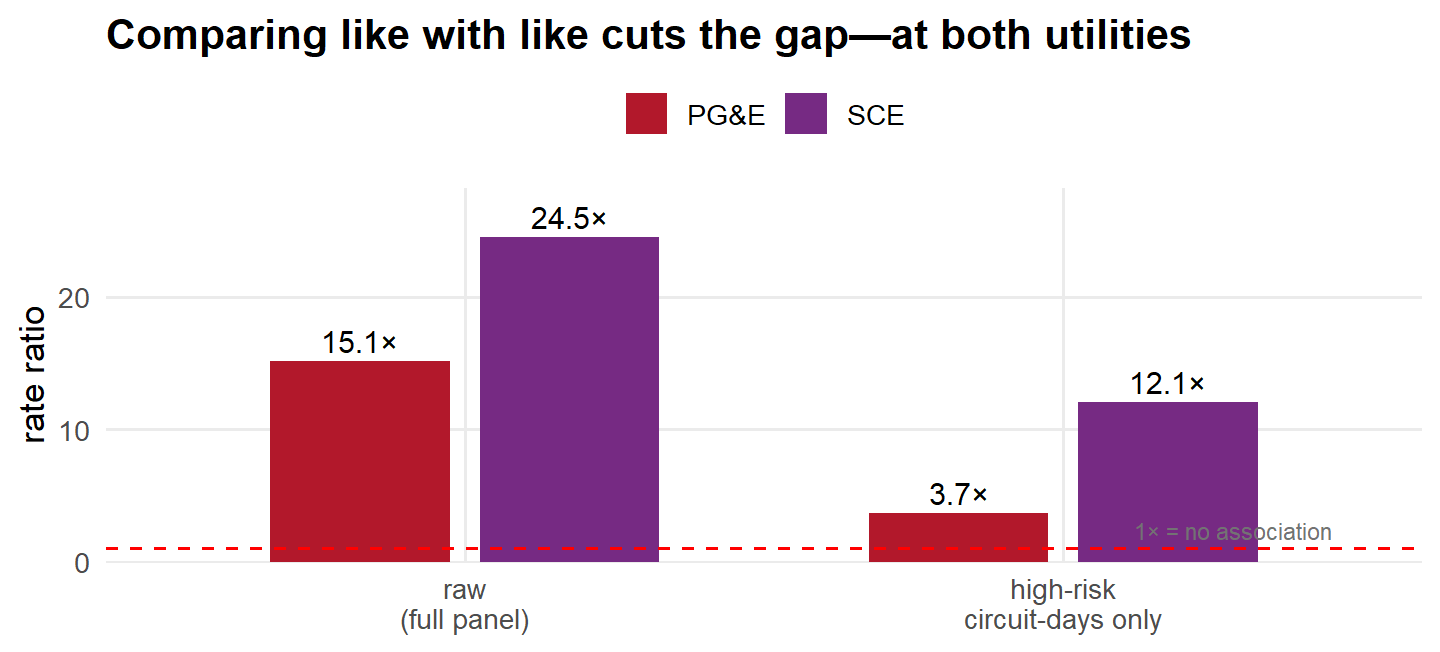
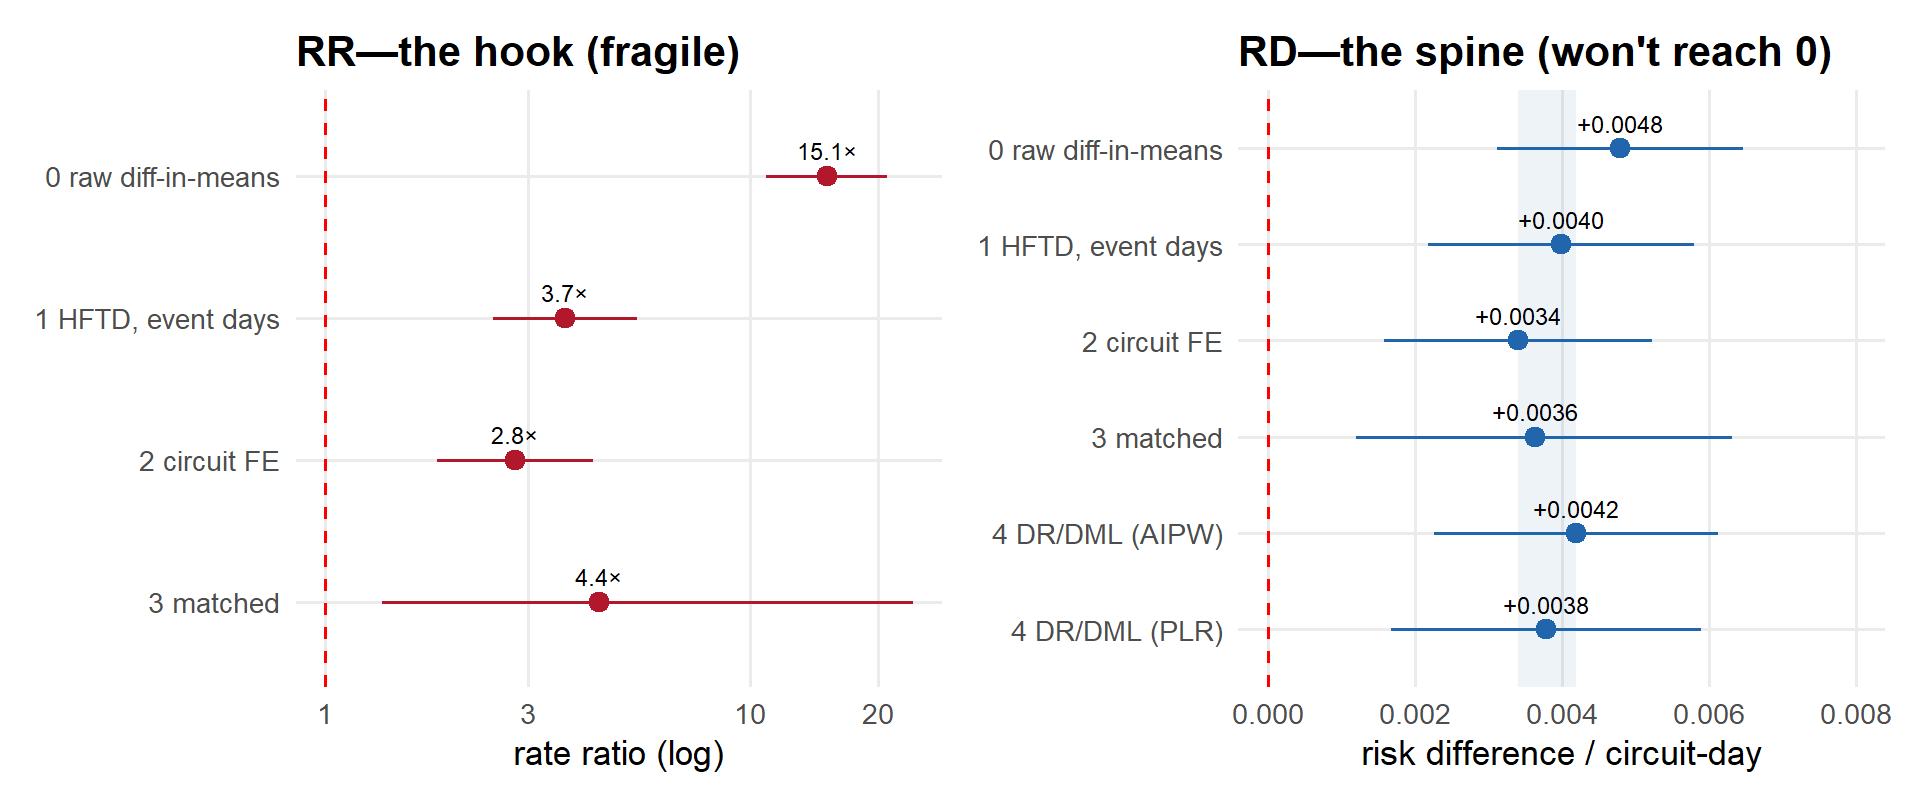
Steps 2–3: Same Circuit, Same Storm — the Gap Survives
| Design | Rate ratio | Risk difference |
|---|---|---|
| Raw difference in means | 15.1× | +0.0048 |
| High-risk circuit-days only | 3.7× | +0.0040 |
| Circuit fixed effects (within-circuit) | 2.8× | +0.0034 |
| Matched within storms (ATT) | 4.4× [1.4, 24.1] | +0.0036 |
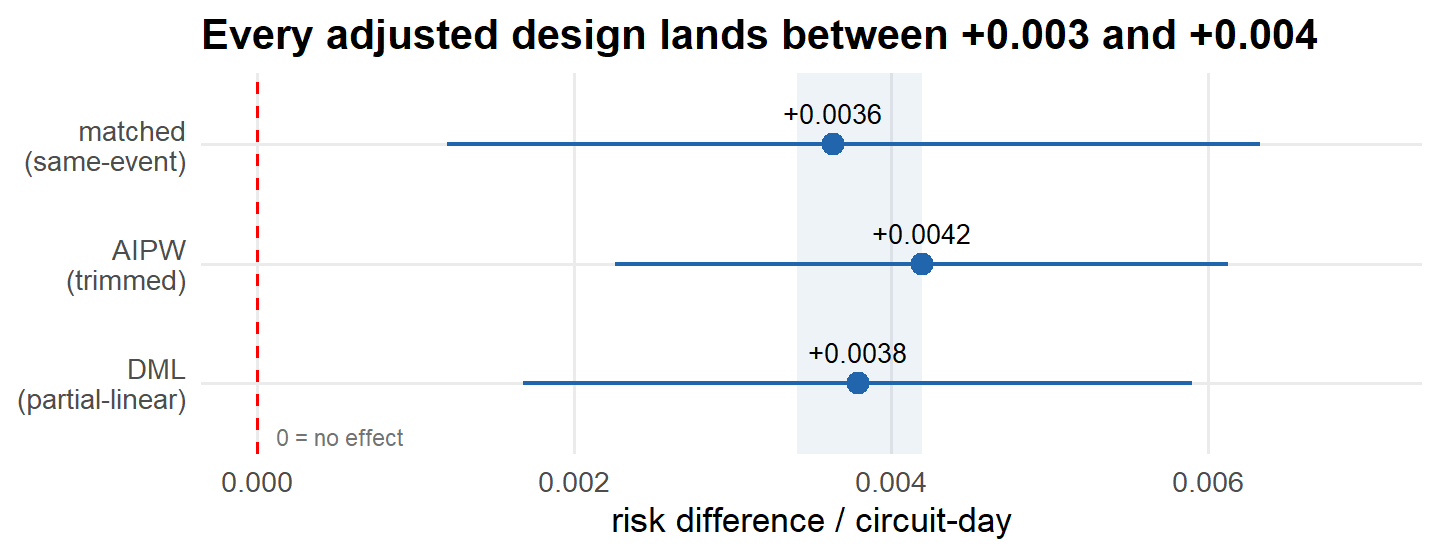
Step 4: Flexible ML Lands in the Same Band
The Bounds Convict the Benchmark
[-0.994, +0.006]
assumption-free Manski band
≤ 0
effect range under monotone treatment response
+0.004
benchmark estimate — outside the MTR band
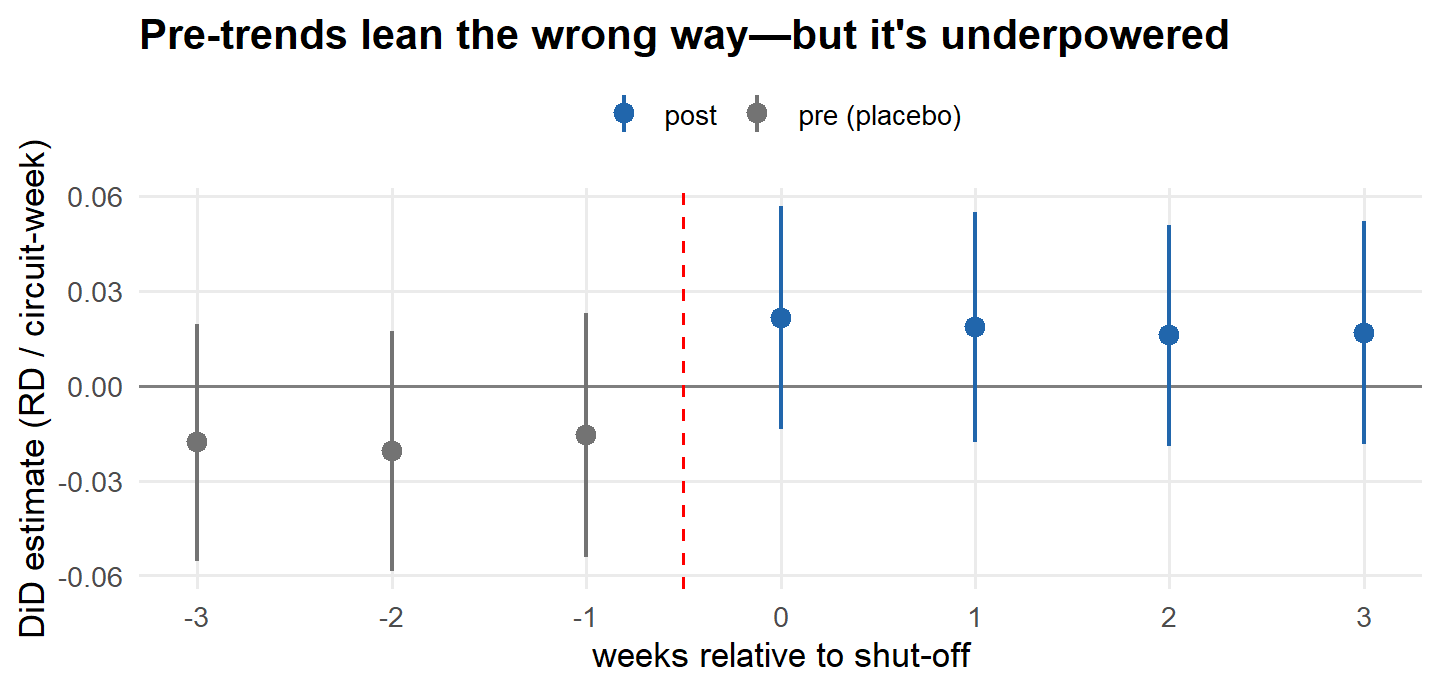
Falsification: A Clean Placebo, With a Blind Spot
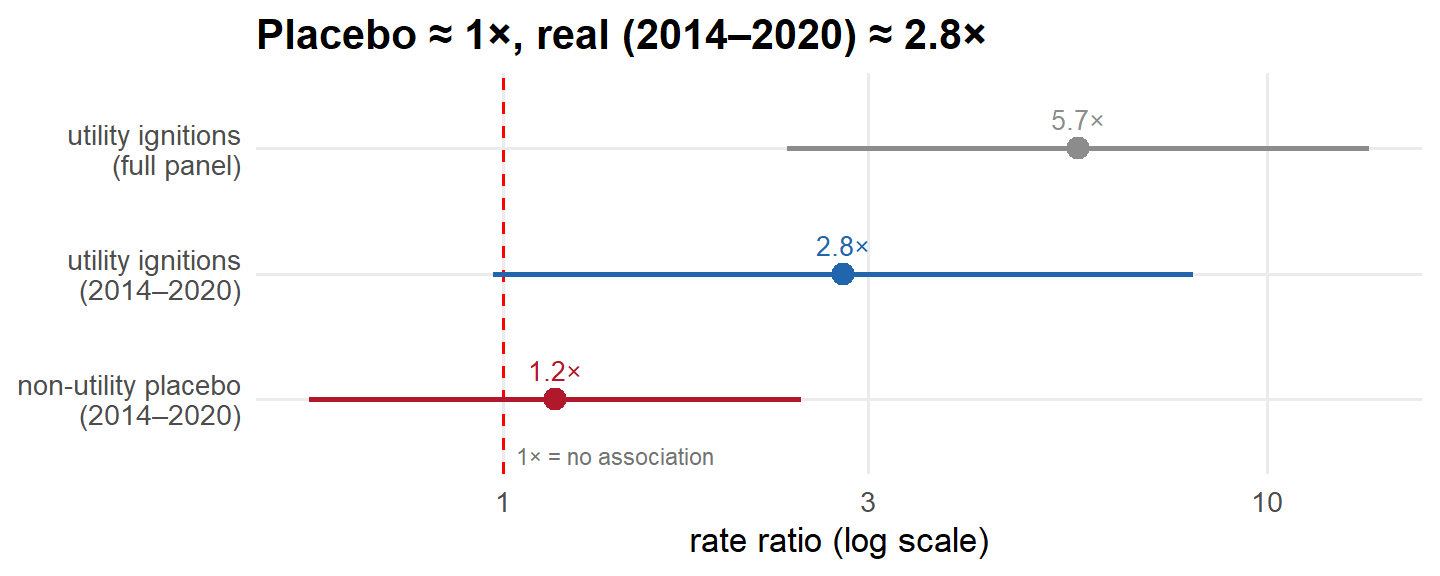
Two Quasi-Experiments, Two Dead Ends
Every Public-Data Approach Lands in the Same Place
What Would Actually Answer the Question
| Design | Identifying variation | Needs from the utility |
|---|---|---|
| Border RD | Adjacent locations, same weather — only one side loses power | Circuit & boundary geometry |
| Fuzzy RD at the FPI cutoff | Circuits just over vs. just under the de-energization threshold | Decision-time FPI values & thresholds |
| Reform-induced DiD, done right | Rule revisions whose timing was policy-driven, not risk-driven | Revision-rationale record |
Key Takeaways
- PSPS benefits are simulated, not measured. The headline "acres avoided" figures are model counterfactuals; the best published study assumes 100% effectiveness. No one had checked against observed ignitions.
- The naive comparison is a trap. Shut-off days show 15× the ignition rate — but utilities de-energize exactly where risk peaks. The raw gap measures the risk, not the policy. Same pattern at SCE (25×).
- Adjustment hits a wall at +0.003 to +0.004. Restriction, fixed effects, matching, and doubly-robust ML all land in the same positive band — and under the mild assumption that de-energized lines can't spark, that number has to be bias, not effect.
- Utility data could settle it. Border RD, fuzzy RD at the FPI cutoff, and a defensible reform DiD are all feasible — but each needs records only utilities hold: scoped-but-not-shut-off controls, decision-time risk scores, boundary geometry, revision rationale.
Igor Geyn · igorgeyn.com